Understanding Micro-Conversions: Definition, Examples, and Best Practices
A micro-conversion is a small, measurable action a visitor takes that signals progress toward a purchase. Examples include adding to cart, signing up for an email list, or watching a product video. These actions don’t generate revenue directly, but they reveal exactly where shoppers engage, hesitate, or drop off before buying.
This guide covers how to identify the micro-conversions that matter for your store. It explains how to calculate and benchmark your rates, diagnose friction, and turn insights into higher conversion rates.
What is a micro-conversion
A small, measurable action a visitor takes that signals progress toward a purchase—but isn’t the purchase itself. Think of actions like adding a product to cart, signing up for an email list, or watching a product video. These moments indicate interest and intent, even though they don’t directly generate revenue.
Picture a shopper who lands on your product page, scrolls through the images, reads a few reviews, and adds the item to their cart. That add-to-cart is a conversion signal. The shopper hasn’t bought anything yet, but they’ve moved one step closer.
The opposite of this small action is a macro-conversion—the primary goal you’re optimizing for. In ecommerce, that’s typically a completed order. Every small engagement action along the way builds toward that final transaction.
- Micro-conversion: A smaller action indicating interest or progress toward a purchase (add to cart, email signup, account creation)
- Macro-conversion: The primary goal, typically a completed order
Micro-conversions vs macro-conversions
The difference between micro and macro conversions changes how you diagnose problems and where you look for fixes.
Behavioral signals vs completed transactions
Micro-conversions are intent signals. They tell you a shopper is interested, engaged, or considering a purchase. Macro-conversions are outcomes—the revenue-generating events you’re working toward.
Consider the difference: a visitor who views the same product page three times over a week is showing strong interest through micro-conversions. When they finally place an order, that’s the macro-conversion. Both matter, but they reveal different things about your funnel.
Why the distinction matters for optimization
If you only track macro-conversions, you’re blind to everything that happens before the purchase. You might know your conversion rate is 2%. But you won’t know whether shoppers are dropping off at the product page, the cart, or the checkout.
These engagement signals reveal the friction points between interest and purchase. When you can see that 40% of visitors add to cart but only 10% reach checkout, you know exactly where to focus. Session replays let you watch what happens at each stage—so you’re not guessing about why shoppers leave.
Micro-conversion examples for ecommerce stores
Different engagement actions signal different levels of purchase intent. Here are the most valuable ones to track.
Add to cart
Adding to cart is the clearest purchase intent signal before checkout. A shopper has evaluated your product and decided they want it enough to take action. Tracking add-to-cart rates by product helps you identify which pages convert browsers into buyers—and which ones fall short.
Email or newsletter signup
An email signup indicates interest beyond a single session. The shopper may not be ready to buy today, but they’re willing to hear from you again. This creates a remarketing opportunity and often precedes a future purchase.
Account creation
Creating an account requires more effort than most micro-conversions, which makes it a stronger commitment signal. Logged-in users typically convert at higher rates because they’ve already invested in a relationship with your store.
Product page views
Repeated views of the same product suggest strong interest. A shopper who returns to a product page three times is evaluating seriously. Track which products get views but not add-to-carts—that gap often points to missing information or unclear value.
Wishlist additions
Wishlist saves signal intent to purchase later. They’re useful for retargeting campaigns and for understanding which products generate demand even when shoppers aren’t ready to buy immediately.
Video and content engagement
Watching a product video or reading reviews shows deeper evaluation. These interactions often precede purchases because they help shoppers overcome uncertainty.
Scroll depth and time on page
Reaching the bottom of a product page or spending significant time reading indicates genuine interest rather than a quick bounce. Scroll maps can show you whether visitors actually see your key selling points or leave before reaching them.
Why micro-conversions matter for Shopify stores
Tracking micro-conversions helps you understand where shoppers drop off before purchasing—and why.
Picture this scenario: your store gets 10,000 visitors per month, but only 200 orders. That’s a 2% conversion rate. Useful, but not actionable.
Now imagine you can see that 3,000 visitors add to cart, 1,500 start checkout, and 200 complete the purchase.
Suddenly you know the biggest drop-off happens between cart and checkout—not on your product pages.
- Identify friction points before they cost you sales
- Prioritize fixes based on where drop-offs actually happen
- Measure optimization impact without waiting for purchase volume changes
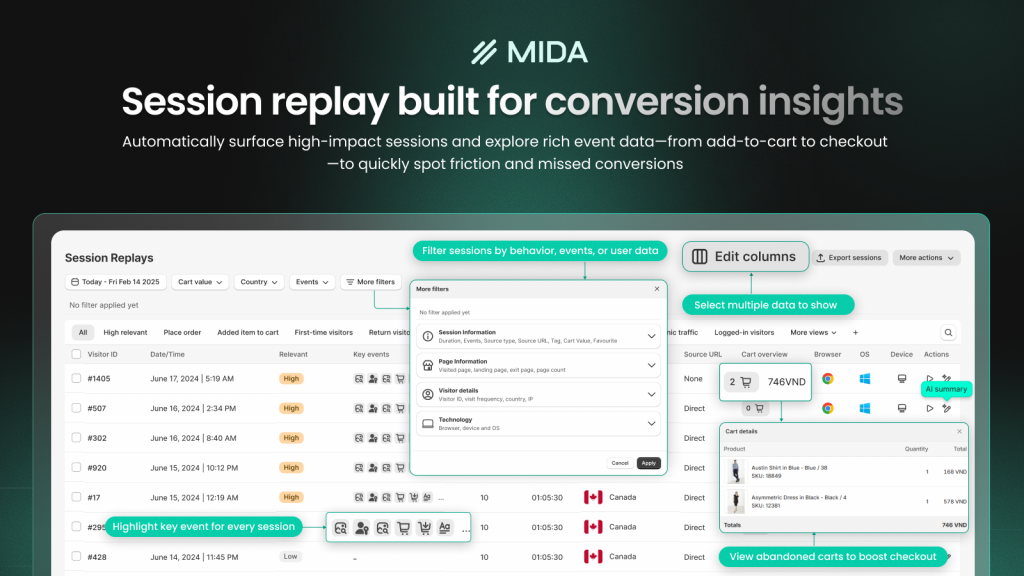
MIDA’s funnel analytics and session replays connect micro-conversion moments to real shopper journeys.
You can watch the exact session behind an abandoned cart. See exactly what happened before the shopper left.
How to calculate micro-conversion rate
Measuring these conversion rates gives you a baseline for improvement and helps you compare performance across different actions, pages, and time periods.
The micro-conversion rate formula
The calculation is straightforward:
Micro-Conversion Rate = (Number of Micro-Conversions ÷ Total Visitors) × 100
- Number of Micro-Conversions: The count of a specific action (add-to-carts, email signups) during your measurement period
- Total Visitors: The number of unique visitors to the relevant page during that same period
Worked calculation example
Say your product page received 5,000 visitors last month, and 400 of them added the product to their cart. Divide 400 by 5,000 to get 0.08, then multiply by 100.
Your add-to-cart rate for that product: 8%.
This number becomes meaningful when you compare it across products, track it over time, or segment it by device and traffic source.
Micro-conversion rate benchmarks by action type
Knowing your rate is useful. Knowing how it compares to relevant ecommerce benchmarks is more useful. Context helps you understand whether you’re facing a normal ecommerce reality or a fixable problem.
| Micro-Conversion Type | Typical Range | What Affects It |
|---|---|---|
| Add to cart | 5–15% | Product page clarity, pricing visibility |
| Email signup | 1–5% | Offer value, form placement |
| Account creation | 1–3% | Perceived benefit, signup friction |
Add-to-cart rate benchmarks
Add-to-cart rates vary by product type, price point, and industry. Lower-priced, impulse-friendly products typically see higher rates than expensive, high-consideration items. A 10% add-to-cart rate might be excellent for furniture but below average for accessories.
Email signup rate benchmarks
Signup rates depend heavily on the incentive offered and form visibility. A 10% discount popup will outperform a generic “subscribe for updates” form. Exit-intent timing often performs better than immediate popups that interrupt browsing.
Account creation rate benchmarks
Account creation is often the lowest micro-conversion rate because it requires the most effort. Many stores see better results by offering guest checkout and prompting account creation after purchase, when trust is already established.
What causes low micro-conversion rates
When these conversion rates fall below expectations, the cause usually traces back to one of a few common conversion killers.
Confusing page layout or navigation
If shoppers can’t find the add-to-cart button or key product details, they won’t convert. Heatmaps reveal where attention goes—and where it doesn’t.
You might discover that your CTA sits below where most visitors scroll.
Slow page load times
Every second of delay increases abandonment. Shoppers are impatient, particularly on mobile, and a slow-loading page signals an unreliable experience before they’ve even seen your content.
Unclear calls to action
Vague or hidden CTAs leave shoppers uncertain about what to do next. “Learn More” is weaker than “Add to Cart.” The action you want visitors to take has to be obvious.
Mobile UX friction
Buttons too small to tap, forms too long for a phone, or layouts requiring pinching and zooming all hurt mobile conversion rates.
Given that mobile traffic often exceeds desktop, these issues affect a large portion of your visitors.
Missing trust signals
First-time visitors to unfamiliar stores are naturally skeptical. Missing reviews, unclear return policies, or absent security badges create hesitation—and hesitation often becomes abandonment.
Distracting or irrelevant content
Too many competing elements pull attention away from the conversion action. Popups, banners, and unrelated promotions can overwhelm shoppers and reduce focus on the primary goal.
How to track and diagnose micro-conversion friction
Finding the specific causes of low conversion rates in your store requires looking at actual shopper behavior, not just aggregate numbers.
Use heatmaps to spot ignored elements
Click heatmaps show which elements get attention and which get skipped entirely. Look for CTAs with low click rates, dead clicks on non-clickable elements, or rage clicks that indicate frustration.

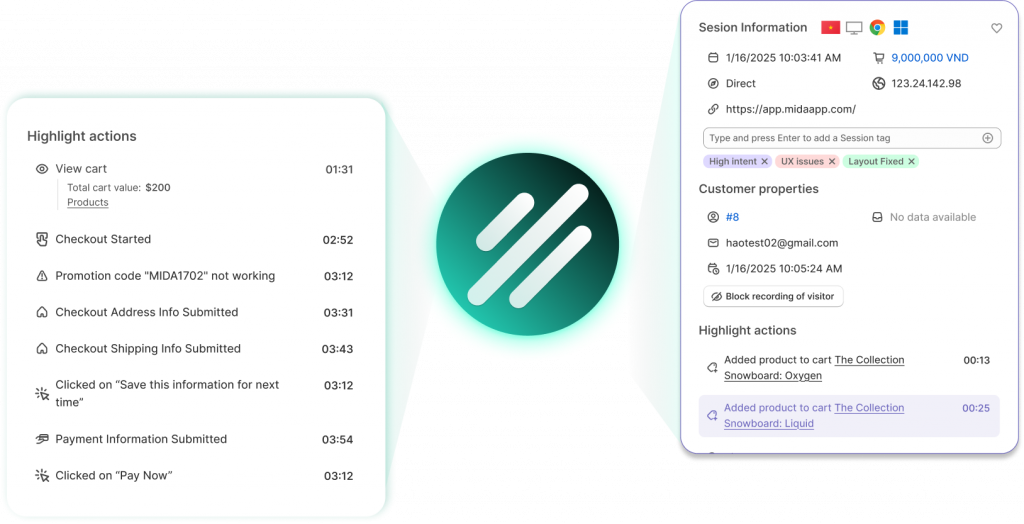
Watch session replays to see drop-off moments
Session recordings let you watch real shopper journeys to see exactly where they hesitate, get confused, or abandon. You’re not guessing about what happened—you’re watching it unfold. MIDA’s Relevance Score automatically surfaces high-impact sessions so you’re not wasting time on random recordings.
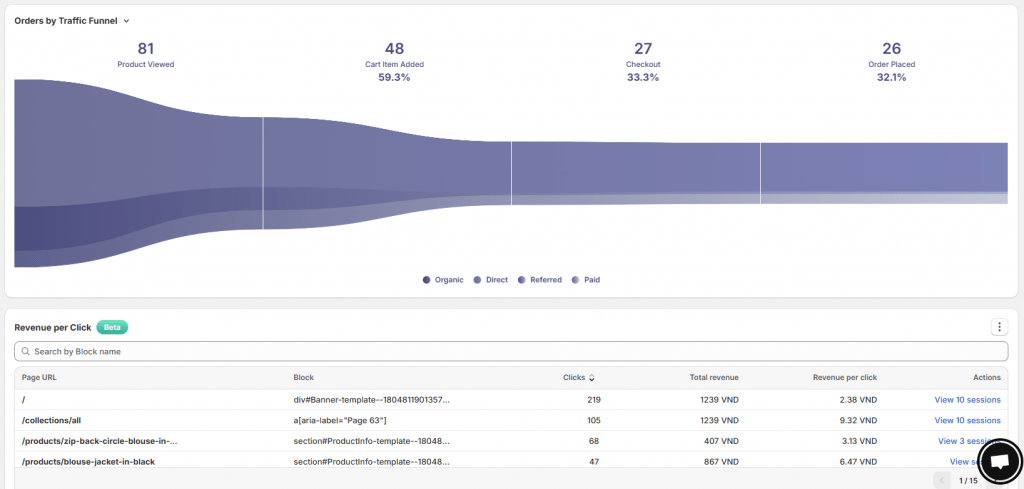
Analyze funnel reports for stage-by-stage losses
Funnel visualization shows the exact step where shoppers exit: product view → add to cart → checkout initiated → purchase complete. A big drop between “add to cart” and “checkout initiated” suggests different issues than a drop at the payment step. Understanding your checkout abandonment rate helps you pinpoint which.
Segment by device and traffic source
Conversion rates often differ dramatically between mobile and desktop, or between paid and organic traffic. Segment your data to find device-specific or source-specific issues. A problem that only affects mobile users requires a different fix than one affecting all visitors.
Strategies to improve micro-conversion rates
The tactics below address the most common conversion barriers. Prioritize based on what your diagnostic work reveals.
1. Simplify your add-to-cart flow
Remove unnecessary steps between product interest and cart addition. Make the button prominent, use clear action-oriented copy, and ensure the action feels immediate.
2. Optimize CTAs for clarity and visibility
Use action verbs, contrasting colors, and placement above the fold. Test different copy variations—sometimes a small wording change produces measurable improvements.
3. Reduce form fields for signups
Every additional field reduces completion rates. Ask only for what you truly need. An email-only signup form will outperform one that also requests name, phone number, and birthday.
4. Fix mobile-specific UX issues
Test your store on actual mobile devices, not just browser preview modes. Look for tap targets that are too small, forms that are hard to complete, or content that requires horizontal scrolling. See our guide on Shopify conversion rate optimization for a full checklist of mobile fixes.
5. Add social proof near conversion points
Place reviews, ratings, or trust badges near add-to-cart buttons and signup forms. Social proof reduces uncertainty at the moment when shoppers are deciding whether to take action.
6. Test page layouts with heatmap data
Use heatmap insights to inform A/B tests. Move high-performing elements up the page; remove or redesign sections that get ignored.
7. Use on-site surveys to understand hesitation
Ask shoppers directly why they didn’t convert. MIDA Survey links responses to session replays, so you can see both what shoppers said and what they actually did.
Turn micro-conversion insights into revenue
Tracking micro-conversions is only valuable if you act on the insights. The goal isn’t to collect data—it’s to identify specific friction points and fix them in priority order.
When you combine heatmaps, session replays, funnel analytics, and on-site surveys, you build a system for continuous improvement. You can see where shoppers drop off, watch exactly what happened, and validate your fixes with real behavioral data.
Try MIDA free — connect shopper behavior to real outcomes and start optimizing your store’s micro-conversions today.
FAQs about micro-conversions
How many micro-conversions should I track on my Shopify store?
Focus on the engagement actions most relevant to your funnel—typically add-to-cart, email signup, and account creation. Tracking too many actions creates noise without adding clarity. Start with three to five key actions and expand only if you have specific questions to answer.
Can a single user action count as both a micro and macro conversion?
No—a single action is one or the other depending on your goal. For most ecommerce stores, a purchase is the macro-conversion and all preceding actions are micro-conversions.
Do micro-conversion rates directly affect SEO rankings?
Micro-conversion rates don’t directly impact SEO. However, the engagement signals they represent—time on site, pages per session, low bounce rates—can indirectly influence search rankings. They do this by signaling content quality to search engines.
Should I create separate tracking events for each micro-conversion type?
Yes—tracking each micro-conversion as a distinct event lets you analyze performance at each funnel stage and pinpoint exactly where drop-offs occur.
How often should I review my store’s micro-conversion data?
Review micro-conversion trends weekly to catch emerging issues early. Do a deeper analysis monthly to measure the impact of optimizations and identify longer-term patterns. The ecommerce conversion optimization checklist can help structure your monthly review.

Hien Tran
I’m Hien Tran, a Product Marketing Executive at MIDA, specializing in eCommerce growth and conversion optimization. I focus on bridging product capabilities with real merchant needs—turning insights from heatmaps, session replays, and funnel analytics into actionable strategies that drive measurable results.


