What Are Dynamic Heatmaps and Why They Matter

A dynamic heatmap is a behavior analytics tool that tracks user interactions on web elements that appear, change, or load after the initial page render—popups, dropdown menus, carousels, and checkout forms that traditional static heatmaps miss entirely.
For ecommerce stores, this distinction matters more than it might seem. Most revenue-critical interactions happen within dynamic elements: selecting product variants, adjusting cart quantities, entering payment details. This guide covers how dynamic heatmaps work, what they can track, and how to use them to find the friction points costing you conversions.
What is a dynamic heatmap
A dynamic heatmap is a behavior analytics tool that tracks user interactions on web elements that appear, change, or load after the initial page render. Traditional heatmaps is a behavior analytics tool that tracks user interactions on web elements that appear, change, or load after the initial page render. Traditional heatmaps capture only a static screenshot of your page. Dynamic heatmaps, by contrast, track evolving content like dropdown menus, popups, carousels, and cart drawers. They use color gradients to represent interaction intensity, with warmer colors showing higher activity.
Picture a shopper on your product page who clicks a size selector dropdown. A static heatmap misses that interaction entirely because the dropdown wasn’t visible when the page first loaded. A dynamic heatmap records every click within that dropdown, showing you which sizes get selected and where shoppers pause.
Modern Shopify stores rely heavily on interactive elements. If your heatmap tool can’t track interactions on slide-out carts, mega menus, or checkout forms, you’re missing behavior data that directly affects conversions.
Static vs dynamic heatmaps
The core difference comes down to what each type can actually see. Static heatmaps capture a fixed snapshot of your page and overlay interaction data on that single state. Dynamic heatmaps track behavior across all the states your page can take, including elements that appear only after user actions.
| Feature | Static Heatmap | Dynamic Heatmap |
|---|---|---|
| What it captures | Fixed page elements visible on load | Interactive elements that appear or change after load |
| Best for | Simple landing pages with minimal interactivity | Cart pages, popups, dropdowns, carousels, checkout flows |
| Key limitation | Misses hidden or changing elements | Requires more sophisticated tracking technology |
Consider a mega menu that expands when a shopper hovers over your navigation. A static heatmap shows clicks on the main navigation bar but nothing about what happens inside the expanded menu. A dynamic heatmap captures every interaction within that menu, revealing which categories attract attention and which get ignored.
Why dynamic heatmaps matter for ecommerce
Dynamic heatmaps capture the interactions that actually drive or block purchases. Most revenue-critical moments on a Shopify store happen within dynamic elements: adding items to cart, selecting variants, entering checkout information, and completing payment.
Capture interactions on pages that change
Product pages, cart drawers, and checkout flows constantly update based on shopper actions. When someone opens your slide-out cart to review items before checkout, a static heatmap sees nothing. A dynamic heatmap captures every click, from quantity adjustments to upsell interactions to the moment they decide to proceed or abandon.
This visibility extends to promotional popups, size guides, and filter menus. Without dynamic tracking, you’re essentially blind to how shoppers interact with some of your most conversion-critical elements.
Connect clicks to conversions and revenue
Seeing where people click is useful, but knowing which clicks lead to purchases is what actually helps you optimize. Revenue-linked heatmapsSeeing where people click is useful, but knowing which clicks lead to purchases is what actually helps you optimize. Revenue-linked heatmaps tie interactions directly to outcomes, showing you which elements drive add-to-cart actions and which clicks never convert.
MIDA’s Shopify-native heatmaps connect behavior data to carts, orders, and revenue. You can see not just that shoppers clicked a promotional banner, but whether those clicks actually resulted in purchases.

Identify friction before it costs you sales
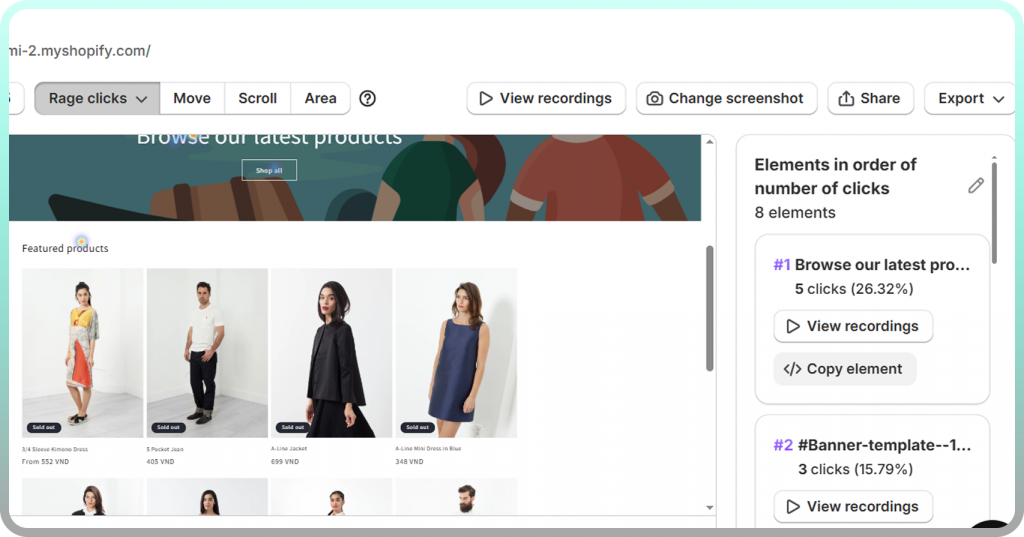
Dynamic heatmaps reveal where shoppers struggle with interactive elements. You might discover rage clicksrage clicks on a dropdown that isn’t responding properly. Or you might find dead clicks on carousel indicators that look clickable but aren’t.
A size selector that’s confusing on mobile, a cart drawer that’s hard to dismiss, a checkout form field causing errors—dynamic heatmaps surface conversion killers before they cost you more sales.
What dynamic heatmaps can track
Dynamic heatmaps capture any element that appears or changes after the initial page load. Here’s what that includes on a typical ecommerce store:
Popups and modals
Email capture forms, exit-intent offers, size guides, and promotional overlays are all invisible until triggered. Dynamic heatmaps show exactly where users click within these elements, whether they engage with the offer, dismiss it immediately, or struggle to find the close button.
Dropdown menus and navigation
Mega menus, filter dropdowns, and sorting options often contain dozens of clickable elements. Dynamic heatmaps reveal which menu items get attention, which filters shoppers actually use, and which navigation paths lead to conversions.
Carousels and image sliders
Product image galleries and featured product sliders are standard on most stores. Dynamic heatmaps show whether shoppers scroll through all images or abandon after the first, and which carousel positions receive the most engagement.
Cart drawers and quick-view windows
Slide-out carts and product quick-view modals are where many purchase decisions happen. Dynamic heatmaps track interactions like quantity changes, upsell clicks, remove-item actions, and clicks on the “proceed to checkout” button.
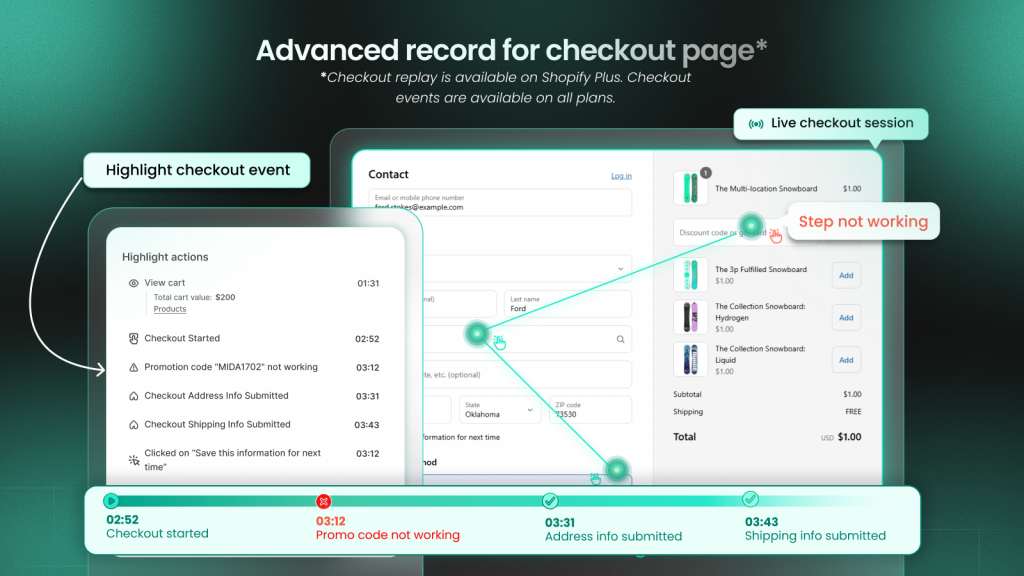
Checkout forms and payment fields
Form field interactions, payment method selections, and shipping option clicks all happen within dynamic checkout flows.
Form field interactions, payment method selections, and shipping option clicks all happen within dynamic checkout flows. MIDA’s advanced checkout page recording captures these interactions even on Shopify’s checkout pages, giving you visibility into one of the most friction-prone stages of the purchase journey.
Types of dynamic heatmaps
Dynamic heatmaps come in several visualization types. Each reveals different behavior patterns, and using them together gives you a complete picture of how shoppers interact with your pages.
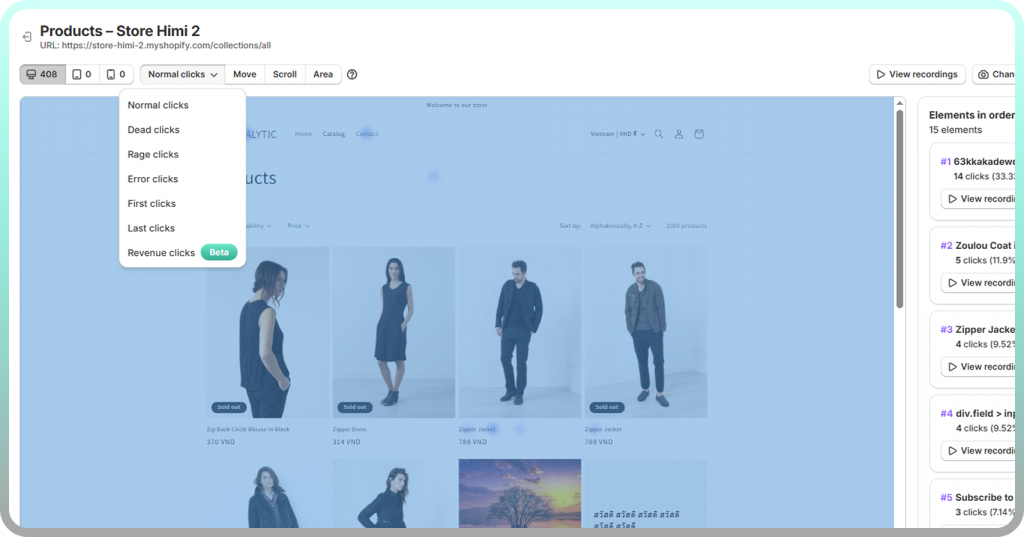
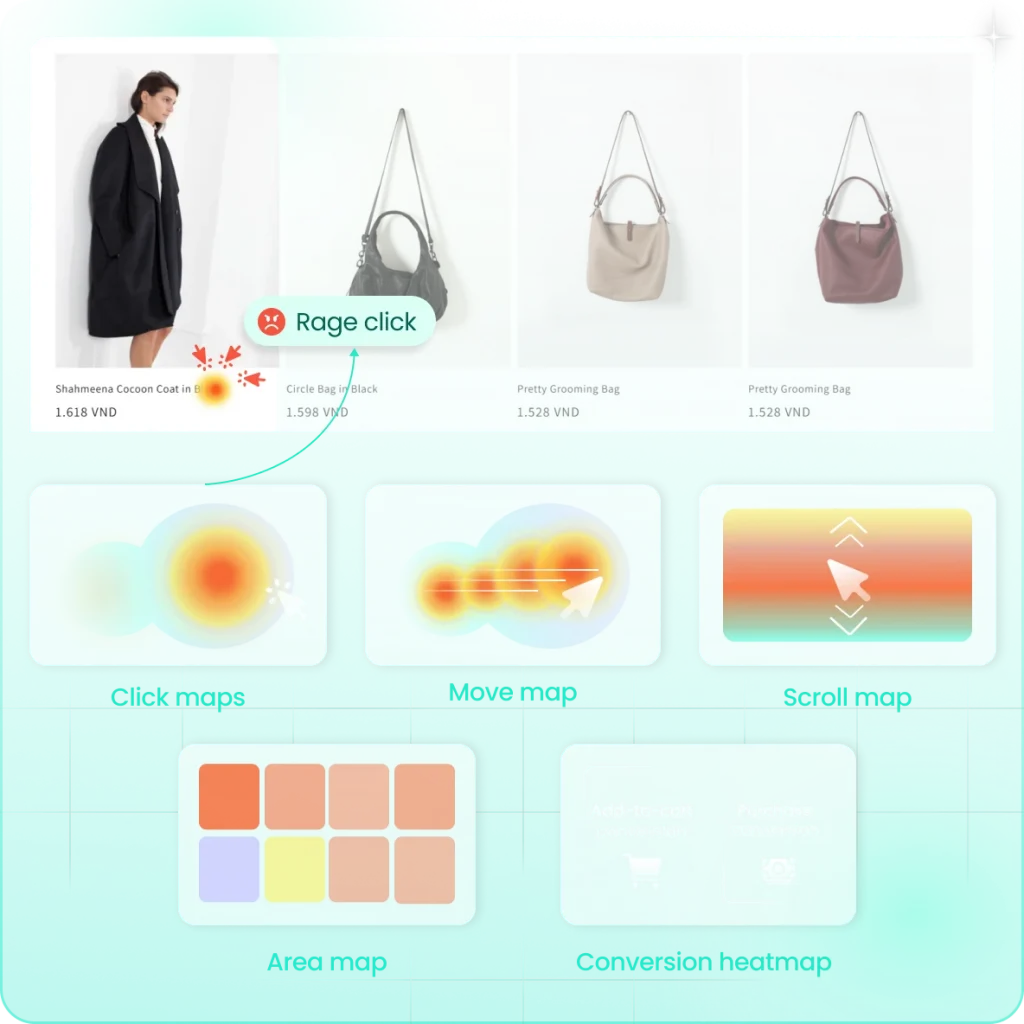
Click heatmaps
A click heatmap is a visual overlay showing where users click, with warmer colors indicating higher click concentration. Several variations exist:
- All clicks: Every tap or click on the page
- Rage clicks: Repeated, frustrated clicking in the same area, often signaling broken elements or confusing UX
- Dead clicks: Clicks on non-interactive elements, indicating shoppers expect something to be clickable when it isn’t
- First/last clicks: Entry and exit interactions that show where attention starts and ends
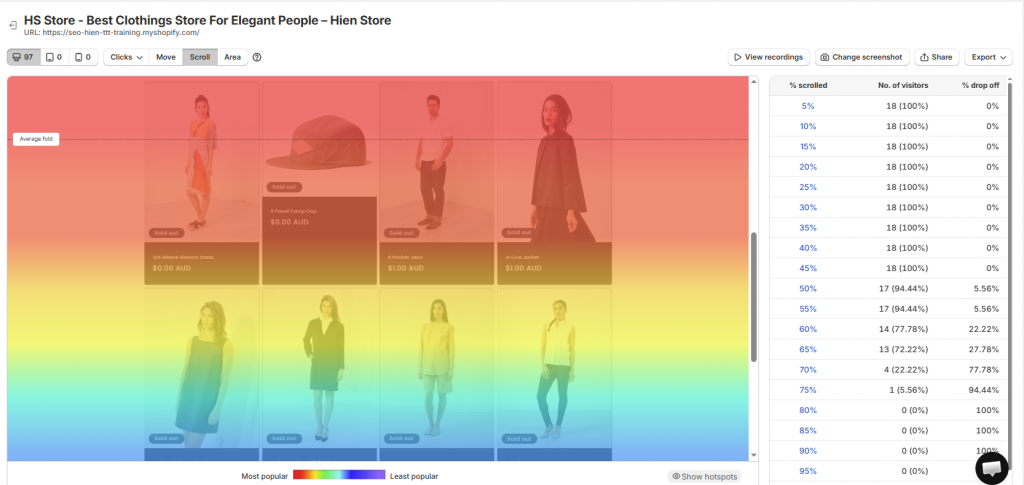
Scroll heatmaps
Scroll heatmaps show how far users scroll and where attention drops off. The average fold represents the typical visible area before scrolling. If your shipping information or trust badges sit below where 70% of visitors scroll, many shoppers never see them.
Move and hover heatmaps
Move and hover heatmaps track cursor movement and hover behavior on desktop. Research suggests cursor movement often correlates with eye movement, making hover maps useful for understanding what shoppers are reading or considering, even without clicks.
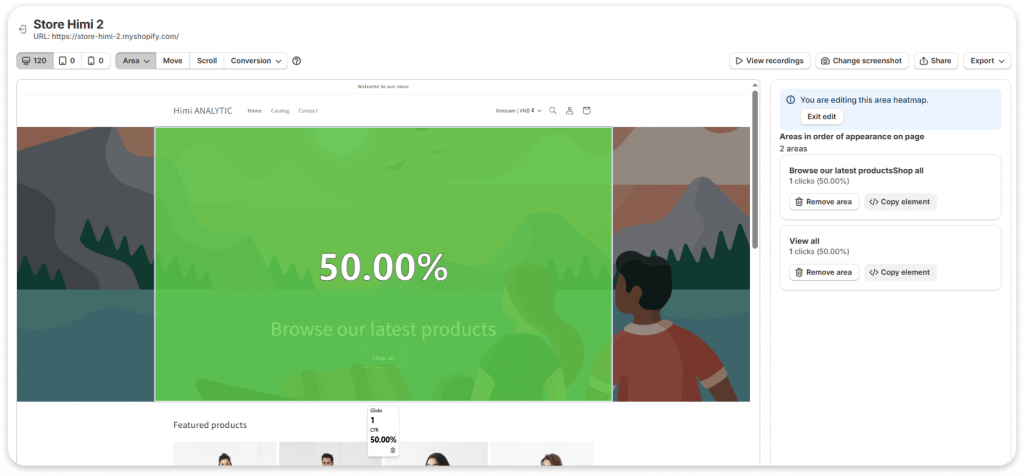
Element-level interaction maps
Also called area maps, element-level interaction maps show the click-through rate (CTR) for specific elements. Rather than just showing where clicks happen, they tell you what percentage of visitors who saw an element actually clicked it. This helps identify both over-performing sections worth emphasizing and under-performing elements that might benefit from redesign.
How to use dynamic heatmaps
Getting actionable insights from dynamic heatmaps requires a systematic approach. The goal is moving from aggregate patterns to specific, prioritized fixes.
1. Identify high-impact dynamic elements
Start with elements tied directly to conversion: add-to-cart buttons, checkout forms, promotional popups, and cart drawers. Prioritize pages with the highest traffic or revenue impact, like your homepage, top product pages, and checkout flow.
2. Segment by device and traffic source
Behavior differs significantly across desktop, tablet, and mobile. A dropdown that works perfectly on desktop might be frustrating on mobile. Use cross-device analysis to spot device-specific UX issues that aggregate data would hide.
Filter by traffic source to see how paid versus organic visitors interact differently. Shoppers from a specific ad campaign might behave differently than those who found you through search.
3. Look for rage clicks and dead clicks
Rage clicks signal frustration. They often indicate broken elements, slow-loading content, or confusing interactions. Dead clicks indicate users expect an element to be interactive when it isn’t, suggesting a design that misleads shoppers.
Both signals point to specific UX problems worth fixing. A cluster of rage clicks on your size selector might reveal a bug you didn’t know existed.
4. Jump from heatmaps to session replays
Heatmaps show you patterns. Session replays show you the story behind those patterns. When you spot an interesting hotspot or concerning cluster of rage clicks, the next step is watching actual sessions where those interactions happened.
MIDA lets you click any heatmap hotspot and instantly watch the recordings where that element was clicked. This “pattern to proof” workflow turns observations into confident diagnoses.
Tip: When you find a friction point in your heatmap, watch at least 5-10 session replays of that interaction before deciding on a fix. What looks like a design problem might actually be a technical bug, or vice versa.
Common mistakes when using dynamic heatmaps
Even with good data, drawing the wrong conclusions is easy. Here are the pitfalls to watch for:
- Ignoring mobile behavior: Desktop heatmaps don’t reflect mobile UX. Always check both, especially since mobile often has higher abandonment rates.higher abandonment rates.
- Drawing conclusions from low traffic: A heatmap based on 50 sessions can be misleading. Wait for sufficient data before making changes, typically at least a few hundred sessions for reliable patterns.
- Focusing only on clicks: Clicks tell you what people did, but scroll maps tell you what they saw. Combine both to understand full page engagement.
- Not connecting to outcomes: Clicks without conversion context Clicks without conversion context are just activity. Use revenue-linked heatmaps to understand which interactions actually matter for your business.
- Skipping session replay validation: Always verify heatmap patterns by watching actual sessions. A hotspot might look like high engagement but actually represent confusion or frustration.
Turn dynamic heatmap insights into revenue gains
Dynamic heatmaps reveal what static tools miss. The value comes from connecting behavior to business outcomes. Seeing that shoppers click your promotional banner is interesting. Knowing whether those clicks lead to purchases is actionable.
With MIDA’s Shopify-native heatmaps, you can see exactly which interactions drive add-to-cart and purchases, then jump directly into session replays for proof. The combination of aggregate patterns and individual session context helps you prioritize fixes based on revenue impact rather than guesswork.
FAQs about dynamic heatmaps
Can dynamic heatmaps track AJAX and single-page applications?
Yes. Dynamic heatmaps are designed to capture interactions on content that loads asynchronously. This includes AJAX requests and single-page application (SPA) elements that update without full page reloads, which are common in modern Shopify themes and apps.
Do dynamic heatmaps affect website loading speed?
Quality dynamic heatmap tools load asynchronously and have minimal impact on page performance. MIDA is built specifically to avoid hurting site speed or Core Web Vitals, which matters both for user experience and SEO.
How many visitor sessions are needed for reliable dynamic heatmap data?
More sessions mean more reliable patterns. You can start seeing useful trends once you have a few hundred interactions on the specific elements you’re analyzing. For high-traffic pages, this might take a day. For lower-traffic pages, you might wait a week or more before drawing conclusions.
Can dynamic heatmaps record Shopify checkout page interactions?
Most generic heatmap tools cannot access Shopify’s checkout pages due to platform restrictions. MIDA offers advanced checkout page recording that captures form interactions, payment selections, and friction points on the checkout page.

Hien Tran
I’m Hien Tran, a Product Marketing Executive at MIDA, specializing in eCommerce growth and conversion optimization. I focus on bridging product capabilities with real merchant needs—turning insights from heatmaps, session replays, and funnel analytics into actionable strategies that drive measurable results.


