How to Calculate Average Order Value (AOV) on Shopify in 2026
Average Order Value (AOV) tells you how much customers spend per transaction on your Shopify store. It’s one of the most direct levers for growing revenue without increasing traffic or ad spend.
This guide covers the exact formula Shopify uses, where to find AOV in your reports, industry benchmarks worth knowing, and practical tactics for diagnosing and improving your number.
What is average order value in ecommerce
Average Order Value (AOV) on Shopify is calculated by dividing total revenue by the total number of orders. Shopify’s updated definition focuses specifically on gross sales minus discounts, which means it excludes post-order adjustments like refunds. This metric tells you how much customers spend per transaction on average.
Picture a customer who adds a jacket, two shirts, and a pair of socks to their cart. The total comes to $127. That single purchase contributes to your store’s overall AOV. When you track this number over weeks and months, you start seeing patterns in how your customers buy.
The metric matters because it connects directly to profitability. Growing your AOV increases revenue from existing traffic without requiring additional ad spend or new customer acquisition.
How to calculate average order value on Shopify
The AOV formula
The calculation is simple:
Total Revenue ÷ Number of Orders = AOV
- Total Revenue: The income generated from sales over a specific period, after discounts are applied
- Number of Orders: The count of completed orders within that same period
If your store generated $25,000 last month from 500 orders, your AOV is $50.
What Shopify includes in its AOV calculation
Shopify calculates AOV using gross sales minus discounts. The platform excludes post-order adjustments like refunds or order edits, and it doesn’t factor in shipping or taxes.
- Included: Product prices, quantities, and discounts applied before order completion
- Not included: Shipping charges, taxes, duties, and post-purchase refunds
This distinction matters when you’re comparing Shopify reports to calculations you run manually or in external tools. If your numbers don’t match, the difference often comes down to what’s being included.
AOV calculation example
Let’s walk through a concrete example. Your store generated $25,000 in total revenue last month from 500 separate orders.
The calculation: $25,000 ÷ 500 = $50 AOV
This means the average customer spends $50 each time they place an order. The real insight comes from tracking how this number changes over time and across different customer segments.
When to use mean vs median for AOV
The standard AOV calculation uses the mean, which can be skewed by outliers. A single $2,000 order can inflate your average significantly, making it seem higher than what a typical customer actually spends.
The median order value is the middle value in a dataset. It’s less affected by unusually large or small orders. If your store sells both $30 accessories and $500 premium items, the median often tells a clearer story about typical customer behavior.
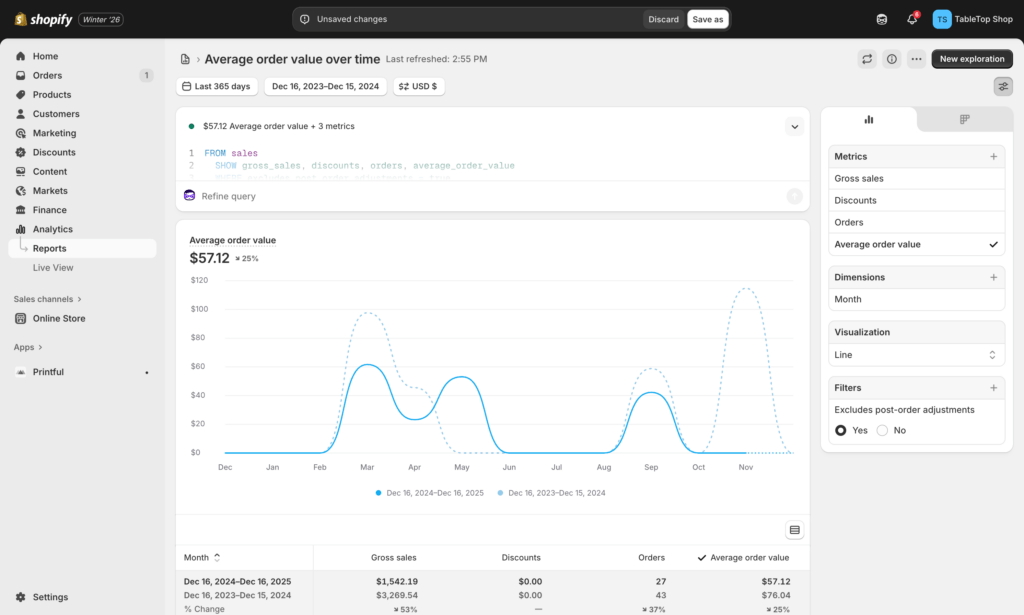
Where to find AOV in Shopify reports
You don’t have to calculate this manually. Shopify surfaces AOV directly in your admin.
From your Shopify Admin, navigate to Analytics > Reports. In the main Sales dashboard, you’ll find an “Average order value” card. For trend analysis, check the “Sales over time” report where AOV appears as a trackable metric.
This built-in reporting saves time. However, AOV is just one of many ecommerce metrics you’ll want to track—segment the data further for deeper insights by device, traffic source, or customer type.
Why AOV matters for Shopify store profitability
AOV connects directly to your bottom line. Consider the difference between acquiring a customer who spends $40 versus one who spends $80. The second customer doubles your revenue for the exact same acquisition cost.
AOV and customer acquisition cost
A higher AOV means you can afford a higher Customer Acquisition Cost (CAC) while remaining profitable. If your profit margin is 50%, a $40 AOV yields $20 in gross profit. An $80 AOV yields $40, giving you twice the budget to spend on ads or marketing.
AOV and customer lifetime value
AOV is a foundational component of Customer Lifetime Value (LTV). A customer’s first purchase amount sets a baseline. Tactics that increase AOV often lead to higher overall LTV across the entire customer relationship.
AOV and conversion rate
There’s often a tradeoff here. Aggressive upsells or a very high free shipping threshold might increase your AOV, but they could also cause some customers to abandon their purchase entirely. The goal is finding the balance that maximizes total revenue, not just one metric in isolation—improving your conversion rate alongside AOV, not just one metric in isolation.
Average order value benchmarks by industry and region
Context matters when evaluating your AOV. A $50 average might be excellent for one store and concerning for another.
AOV by product category
| Category | Typical AOV Range | Why |
|---|---|---|
| Fashion & Apparel | Moderate ($60–$100) | Multiple items per order are common |
| Home & Furniture | High ($150–$300+) | High individual ticket prices |
| Beauty & Cosmetics | Lower ($40–$70) | Smaller products, repeat purchases |
| Electronics | High ($100–$250+) | High unit prices per item |
Your own historical data matters more than industry averages. A 10% drop in your AOV signals something changed, regardless of where you sit relative to competitors.
AOV by region
AOV differs by market. Purchasing power, economic conditions, and shipping expectations all vary by geography. North American AOV often differs from European or APAC markets, so segment your data accordingly if you sell internationally.
Factors that influence Shopify AOV
Checkout friction and UX issues
Confusing checkout flows, unexpected shipping costs, or slow-loading pages can cause shoppers to abandon carts. This happens especially with higher-value carts. Session replay tools reveal exactly where friction occurs by showing you the hesitation and confusion that analytics dashboards can’t capture.
Device and channel mix
Mobile shoppers often have a lower AOV than desktop shoppers. Smaller screens make it harder to browse multiple items, and mobile sessions tend to be faster and more goal-oriented. If your mobile traffic is growing but AOV isn’t keeping pace, mobile conversion gap is worth investigating.
Product pricing and catalog structure
How you structure pricing tiers and whether you offer bundles directly influences cart size. A store with only single-item purchases will naturally have a different AOV than one that encourages multi-product orders.
Shipping thresholds and free shipping policies
Free shipping thresholds are one of the most direct levers for increasing AOV. Customers are often willing to add another item to avoid paying for shipping, especially if you show them exactly how close they are to qualifying.
Discounting frequency and depth
Heavy and frequent discounting can train customers to wait for sales. Over time, this erodes your baseline AOV as shoppers learn to never pay full price—one of several ecommerce conversion killers that erodes your baseline AOV as shoppers learn to never pay full price.
Upsell and cross-sell placement
The visibility, timing, and relevance of your upsell offers directly impact cart size. If customers don’t see the recommendations, or if the recommendations aren’t relevant to what they’re buying, they won’t add them.
How to increase average order value on Shopify
1. Add a free shipping progress bar
Implement a dynamic bar in the cart showing customers how close they are to free shipping. “You’re only $15 away!” creates a visual cue that motivates additional purchases.
2. Create product bundles and kits
Group complementary products together and sell them as a single “kit” at a slight discount compared to buying each item separately. A camera store might bundle a camera, lens, and memory card.
3. Upsell higher-value product alternatives
On product pages, present premium or upgraded versions of the item a customer is viewing. A “Customers also considered” section can guide them toward higher-priced options.
4. Cross-sell complementary products
Recommend relevant add-ons in the cart or at checkout. If a customer adds shoes, cross-sell shoe cleaner or premium laces.
5. Offer volume or tiered discounts
Encourage larger purchases with tiered promotions like “Buy 2, get 10% off; Buy 3, get 15% off.”
6. Launch a customer loyalty program
Points-based rewards programs incentivize larger purchases. Customers spend more to earn rewards faster.
7. Implement post-purchase upsells
One-click offers that appear after checkout completion capture additional revenue without requiring customers to re-enter payment information.
How to diagnose low AOV with behavior data
Watch high and low AOV sessions side by side
Compare session recordings of customers who placed high-value orders against those who placed low-value ones. This comparison reveals behavioral differences in browsing patterns, page visits, and hesitation points. Shopify analytics apps like MIDA let you filter sessions by order value to make this comparison straightforward.
Analyze checkout pages with heatmaps
Click and scroll heatmaps on your cart and checkout pages show whether shoppers are missing your upsell prompts, getting confused by the layout, or abandoning at specific fields.
Identify device-specific AOV gaps
Segment your AOV data by device. If mobile AOV is significantly lower than desktop, watch mobile-specific session recordings to find UX issues that only appear on smaller screens.
Common AOV mistakes Shopify merchants avoid
Chasing AOV at the expense of conversion rate
Aggressive pop-up upsells or an unattainably high free shipping threshold can frustrate customers and cause them to abandon entirely. This hurts overall revenue even if individual order values increase.
Ignoring product margins
A higher AOV is only beneficial if it leads to higher profit. If you increase AOV through heavy discounting, you might be selling more but making less money.
Over-relying on discounts
Training customers to only buy during sales is a dangerous long-term approach. It erodes brand value and permanently lowers your potential AOV.
Start optimizing your Shopify AOV today
Growing your store’s profitability starts with knowing your current AOV, benchmarking it against relevant standards, and diagnosing underlying issues with actual user behavior. A structured conversion optimization checklist helps you prioritize those fixes systematically. When you can see where customers hesitate or get confused, you can prioritize fixes based on real impact rather than guesswork.
See exactly where your shoppers drop off and why.
FAQs about average order value on Shopify
Does Shopify AOV include tax and shipping?
No. Shopify’s default AOV calculation uses gross sales minus discounts and does not include tax or shipping charges.
What is the difference between AOV and ARPU?
AOV measures revenue per order, while ARPU (Average Revenue Per User) measures revenue per customer over a time period. ARPU can include multiple orders from the same person.A related metric, revenue per visitor, divides total revenue by unique visitors—useful for connecting AOV to traffic performance. ARPU can include multiple orders from the same person.
How often should I recalculate my Shopify AOV?
Review your AOV at least monthly. During high-traffic periods like sales events or new product launches, checking weekly helps you catch trends early.
Can a high AOV hurt my conversion rate?
Yes. Aggressive upsells or free shipping thresholds set too high can cause some shoppers to abandon their carts rather than spend more.
How does Buy Now Pay Later affect AOV?
BNPL options like Shop Pay Installments often increase AOV. They make larger purchases feel more affordable by spreading payments over time, which encourages customers to commit to higher cart values.
Should I track AOV by traffic source or campaign?
Yes. Segmenting AOV by UTM source or marketing campaign helps you identify which channels bring in higher-value customers, allowing you to optimize ad spend for maximum profitability.

Hien Tran
I’m Hien Tran, a Product Marketing Executive at MIDA, specializing in eCommerce growth and conversion optimization. I focus on bridging product capabilities with real merchant needs—turning insights from heatmaps, session replays, and funnel analytics into actionable strategies that drive measurable results.


