30 Ecommerce Metrics and KPIs to Optimize Your Store in 2026
Ecommerce metrics are the quantifiable measurements that track your online store’s performance—sales, marketing efficiency, and customer behavior. They tell you whether your business is growing or shrinking, which channels actually drive revenue, and where shoppers drop off before buying.
This guide covers 30 key metrics organized by category, how to calculate them, industry benchmarks, and how to diagnose problems when the numbers don’t look right.
What are ecommerce metrics
Ecommerce metrics are quantifiable measurements that track your online store’s performance across sales, marketing, and customer behavior. They help you identify growth opportunities, evaluate strategy effectiveness, and make informed decisions about where to focus optimization efforts.
Picture tracking how many visitors complete a purchase versus how many leave with items still in their cart. Or knowing exactly how much it costs to acquire a new customer compared to how much revenue that customer generates over time. Without measurement, you’re making decisions based on intuition rather than evidence.
Ecommerce metrics vs KPIs
Metrics are any measurable data point your store generates. KPIs (key performance indicators) are the specific metrics tied directly to your business goals.
Think of metrics as all the instruments on your car’s dashboard. KPIs are the gauges you check most often based on where you’re driving. A store focused on profitability might treat gross margin as a KPI, while a store in growth mode might prioritize customer acquisition cost instead.
| Aspect | Metric | KPI |
|---|---|---|
| Scope | Any measurable data | Tied to specific goals |
| Example | Total page views | Conversion rate |
| Usage | General tracking | Strategic decisions |
Why track ecommerce metrics and KPIs
Tracking lets you spot problems before they become expensive and identify opportunities while they’re still actionable.
- Identify revenue leaks: See exactly where shoppers drop off in your funnel
- Evaluate marketing ROI: Know which channels drive actual purchases, not just clicks
- Spot friction points: Find where customers get stuck before it costs you sales
- Replace guesswork: Make decisions based on evidence rather than assumptions
Consider the LTV:CAC ratio, which divides Customer Lifetime Value by Customer Acquisition Cost. A healthy ratio is generally 3:1, meaning you generate $3 for every $1 spent on acquisition. This single combination tells you whether your business model is sustainable.
30 key ecommerce metrics and KPIs to track
The following metrics are organized by what they measure: conversion, revenue, traffic, acquisition, retention, and behavior. Not every metric will be a KPI for your store, but understanding each one helps you choose which to prioritize.
Conversion rate
Conversion rate is the percentage of visitors who complete a purchase. A 2% conversion rate means two out of every hundred visitors buy something.
This metric directly measures whether your store actually sells. It’s often called the “holy grail” of ecommerce metrics for that reason.
>> See more: 15 Proven Strategies to Improve Ecommerce Conversion Rates in 2026
Add-to-cart rate
Add-to-cart rate measures the percentage of visitors who add at least one item to their cart. It’s a leading indicator of purchase intent and reveals how well your product pages are working.
The gap between your add-to-cart rate and your conversion rate tells you something important. If many people add items but few complete purchases, the friction lives in your checkout process.
Cart abandonment rate
Cart abandonment rate measures shoppers who add items but leave without purchasing. Common causes include unexpected shipping costs, complicated checkout processes, and forced account creation.
This metric represents recoverable revenue because the shoppers already showed purchase intent.
Checkout abandonment rate
Checkout abandonment tracks drop-off specifically after a shopper has initiated the purchase process. Someone who started checkout showed stronger intent than someone who only added to cart, so something specific stopped them.
Micro-conversion rate
Micro-conversions are smaller actions that lead toward a purchase: email signups, wishlist additions, account creation, or product video views. Tracking micro-conversions helps you understand the full customer journey, not just the final purchase moment.
Average order value
Average Order Value (AOV) is the average amount spent per transaction. Calculate it by dividing total revenue by number of orders.
AOV matters because increasing it grows revenue without requiring more traffic. Strategies like product bundling, upsells, and free shipping thresholds directly target this metric.
Revenue per visitor
Revenue Per Visitor (RPV) combines conversion rate and AOV into a single number. Calculate it by dividing total revenue by total visitors.
Two stores might have identical conversion rates, but the one with higher AOV will have higher RPV and likely higher profitability.
Total revenue
Total revenue is your gross sales figure before deductions. It’s a top-line metric that provides context but requires other metrics to be actionable. High revenue means little if your margins are thin or your acquisition costs are unsustainable.
Gross profit margin
Gross profit margin is revenue minus the cost of goods sold (COGS), expressed as a percentage. It tells you how much money you keep from each sale before operating expenses.
This metric varies dramatically by business model. A dropshipping store might operate on 20% margins while a private-label brand targets 60%.
Net profit margin
Net profit margin is what remains after all expenses: marketing, operations, shipping, overhead. A store can have impressive revenue and still lose money. Net margin reveals the reality.
Website traffic
Website traffic is the total number of visitors to your store. It’s foundational but often misleading when viewed in isolation.
Traffic alone is a vanity metric. A thousand visitors who don’t buy are worth less than a hundred who do.
Traffic by source
Traffic sources include organic search, paid ads, social media, direct visits, referrals, and email. Segmenting by source reveals which channels drive valuable visitors.
You might discover that your paid traffic converts at 1% while your email traffic converts at 8%. That insight changes how you allocate budget.
Traffic by device
Segmenting by device (desktop, mobile, tablet) reveals device-specific problems. If your mobile traffic is growing but mobile conversions aren’t keeping pace, you likely have a mobile UX problem worth investigating.
Bounce rate
Bounce rate is the percentage of visitors who leave after viewing only one page. A high bounce rate can signal poor landing page relevance, slow load times, or a mismatch between your ad copy and page content—all common conversion killers worth diagnosing.
Context matters here. A blog post might naturally have a higher bounce rateContext matters here. A blog post might naturally have a higher bounce rate than a product page, and that’s not necessarily a problem.
Exit rate
Unlike bounce rate, exit rate measures the percentage of visitors who leave from a specific page, even if they viewed other pages first. A high exit rate on your cart page tells a different story than a high exit rate on your thank-you page.
Pages per session
Pages per session is the average number of pages a visitor views during a single visit. Higher numbers generally indicate engagement, though sometimes fewer pages to purchase is better because it indicates an efficient path to checkout.
Average session duration
Average session duration measures time spent on your site per visit. Longer isn’t always better. A long session on a checkout page could signal confusion or friction rather than engagement.
Scroll depth
Scroll depth measures how far down a page visitors scroll. It reveals whether key content like calls-to-action, product details, and trust signals is actually being seen.
If your “Add to Cart” button sits below where most visitors scroll, you have a visibility problem that quantitative metrics alone won’t reveal.
Customer acquisition cost
Customer Acquisition Cost (CAC) is the total marketing and sales spend required to acquire one new customer. Calculate it by dividing total acquisition spend by number of new customers.
If it costs you $50 to acquire a customer who only spends $40, you’re losing money on every sale.
Cost per click
Cost Per Click (CPC) is what you pay for each click on your ads. It’s a key metric for managing paid advertising efficiency. What matters is whether your CPC allows for profitable customer acquisition.
Click-through rate
Click-Through Rate (CTR) is the percentage of people who click your ad or email after seeing it. A low CTR suggests your targeting or messaging isn’t resonating. A high CTR with low conversions suggests a disconnect between your ad and your landing page.
Customer lifetime value
Customer Lifetime Value (CLV or LTV) is the total revenue you can expect from a single customer over their entire relationship with your brand. For sustainable growth, your CLV has to exceed your CAC.
Customer retention rate
Customer retention rate is the percentage of existing customers who return to make another purchase over a specific period. Acquiring a new customer typically costs five to seven times more than retaining an existing one.
Repeat purchase rate
Repeat purchase rate measures how frequently customers make a second and subsequent purchase. A low repeat purchase rate might signal product quality issues, poor post-purchase experience, or simply a product category that doesn’t lend itself to repeat buying.
Churn rate
Churn rate is the rate at which customers stop buying from you. It’s particularly important for subscription businesses but relevant for any store tracking customer cohorts. Understanding why customers leave is often more valuable than knowing that they left.
Net promoter score
Net Promoter Score (NPS) measures customer satisfaction and likelihood to recommend your brand. It’s typically collected via survey, asking customers to rate their likelihood to recommend on a 0-10 scale.
Rage clicks
Rage clicks are rapid, repeated clicks on a specific element, signaling user frustration. This behavioral metric reveals UX problems that quantitative data misses entirely. Session replay tools surface the moments where visitors get frustrated and show you exactly why.
Dead clicks
Dead clicks are clicks on non-interactive elements, places where visitors expect something to happen but nothing does. A button that looks clickable but isn’t creates friction.
Form abandonment rate
Form abandonment rate is the percentage of users who start filling out a form but don’t complete it. Long forms, confusing fields, and unexpected requirements all drive form abandonment.
Page load time
Page load time is how long it takes for a page to fully render. Every second of delay increases bounce rates and decreases conversions.
How to calculate key ecommerce metrics
Understanding the formulas helps you calculate metrics manually and verify what your analytics tools report.
Conversion rate formula
Formula: (Number of Purchases ÷ Total Visitors) × 100
If you had 100 purchases from 5,000 visitors, your conversion rate is (100 ÷ 5,000) × 100 = 2%.
Average order value formula
Formula: Total Revenue ÷ Number of Orders
If you generated $10,000 from 200 orders, your AOV is $10,000 ÷ 200 = $50.
Customer lifetime value formula
Formula: Average Order Value × Purchase Frequency × Customer Lifespan
If your AOV is $50, customers buy twice per year, and they remain customers for three years, your CLV is $50 × 2 × 3 = $300.
Customer acquisition cost formula
Formula: Total Marketing Spend ÷ Number of New Customers Acquired
Include all acquisition costs: ad spend, content creation, sales team salaries. If you spent $5,000 and acquired 100 customers, your CAC is $50.
Cart abandonment rate formula
Formula: (Carts Created − Completed Purchases) ÷ Carts Created × 100
If 500 carts were created and 150 purchases completed, your abandonment rate is (500 − 150) ÷ 500 × 100 = 70%.
Customer retention rate formula
Formula: ((Customers at End of Period − New Customers Acquired) ÷ Customers at Start of Period) × 100
Define your time period clearly, whether monthly, quarterly, or annually, for consistent tracking.
Ecommerce benchmarks by industry
Benchmarks provide context. Your metrics mean more when compared to relevant standards, though your own historical data often matters more than industry averages.
Conversion rate benchmarks
| Industry | Average Conversion Rate |
|---|---|
| Fashion & Apparel | 1.5% – 3.5% |
| Health & Beauty | 2.5% – 4.5% |
| Electronics | 1.0% – 2.5% |
| Home Goods | 1.0% – 2.0% |
Mobile typically converts at lower ratesMobile typically converts at lower rates than desktop, often 1-2 percentage points lower.
Average order value benchmarks
| Industry | Average Order Value |
|---|---|
| Fashion & Apparel | $75 – $150 |
| Health & Beauty | $50 – $100 |
| Electronics | $150 – $300 |
| Home Goods | $200 – $500 |
Cart abandonment rate benchmarks
| Industry | Average Cart Abandonment |
|---|---|
| Fashion & Apparel | 65% – 75% |
| Electronics | 70% – 80% |
| Travel | 80% – 85% |
Some abandonment is natural because shoppers comparison shop and use carts as wishlists.
Bounce rate benchmarks
| Page Type | Average Bounce Rate |
|---|---|
| Landing Pages | 60% – 90% |
| Product Pages | 20% – 40% |
| Blog Posts | 70% – 90% |
How often to track ecommerce metrics
Different metrics require different monitoring cadences. Not everything warrants daily attention.
Daily metrics
Check daily to catch problems fast:
- Website traffic
- Conversion rate
- Total revenue
- Any sudden anomalies
Weekly metrics
Review weekly to spot patterns:
- Traffic by source
- Top-selling products
- Cart abandonment trends
Monthly metrics
Use monthly reviews for strategic analysis:
- Customer acquisition cost
- Average order value trends
- Customer retention rate
- Marketing channel performance
Quarterly metrics
Review quarterly for big-picture planning:
- Customer lifetime value
- Churn rate
- Net promoter score
- Year-over-year comparisons
How to diagnose underperforming ecommerce metrics
Numbers tell you what happened. Behavioral data shows you why.
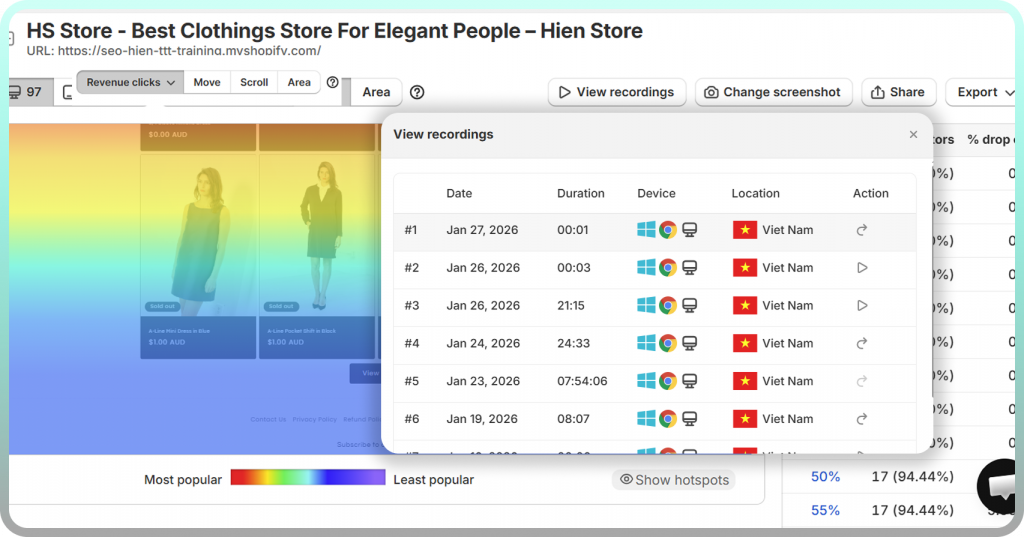
Use session replays to see real behavior
Session replays let you watch actual customer journeys: where they paused, what they clicked, where they seemed confused, and the exact moment they left.
Shopify-native tools like MIDA connect recordings to specific orders and abandoned carts, so you can watch the session behind any outcome and understand what actually happened.
Analyze heatmaps for click and scroll patterns
Heatmaps visualize aggregate behavior across many visitors. Heatmap analysis visualizes aggregate behavior across many visitors. Click maps show where people click, including dead clicks on non-interactive elements. Scroll maps reveal how far down the page visitors actually go.
Revenue-connected heatmaps show which clicks lead to purchases versus which lead nowhere.
Review funnel drop-off points
Funnel visualizations show exactly which step loses the most shoppers. A big drop between “add to cart” and “checkout initiated” suggests different problems than a drop between “payment info” and “purchase complete.”
Collect feedback with on-site surveys
Sometimes the fastest path to understanding is asking directly. Exit-intent surveys capture reasons that behavioral data can’t reveal:
- “I couldn’t find my preferred payment method”
- “Shipping cost was higher than expected”
- “I wasn’t sure about the return policy”
When survey responses connect to session recordings, you get the complete picture.
Segment by device and traffic source
Aggregate metrics can hide device-specific or channel-specific problems. Your mobile site might be converting poorly while desktop performs well, and you won’t know without segmenting.
Strategies to improve your ecommerce performance metrics
Prioritize based on what your diagnostic work reveals rather than implementing everything at once.
1. Simplify your checkout flow
Fewer steps, guest checkout options, and progress indicators directly improve checkout abandonment and overall conversion rate.
2. Add trust signals to product and checkout pages
Customer reviews, security badges, and clear return policies address the security concerns that cause cart abandonment.
3. Optimize product pages for mobile
Responsive images, thumb-friendly buttons, and fast load times address mobile-specific conversion gaps.
4. Offer free shipping thresholds to increase AOV
Set a threshold just above your current AOV to incentivize larger orders.
5. Reduce page load time
Compress images, minimize scripts, and use a CDN. Speed improvements affect both bounce rate and conversion rate.
6. Use exit-intent offers to recover abandoners
Trigger relevant offers when visitors show leaving behavior. This reduces abandonment and captures emails for remarketing.
7. Personalize recommendations to boost CLV
Show relevant products based on browsing and purchase history to increase repeat purchases and lifetime value.
8. A/B test high-traffic pages
Test variations of key pages to find what converts better. This is a data-driven approach to improving multiple metrics simultaneously.
Best tools for tracking ecommerce metrics
Several categories of tools exist: native platform analytics like Shopify Analytics, Google Analytics, and dedicated ecommerce analytics platforms.
The best tools connect behavioral data to business outcomes. A Shopify-native option like MIDA ties session replays, heatmaps, and analytics together with your order data, so you can see not just that metrics dropped but exactly why.
Turn ecommerce metrics into revenue growth
Tracking metrics is only valuable if you act on them. The gap between data and action is understanding real customer behavior.
See exactly where your Shopify store loses revenue and why.
FAQs about ecommerce metrics
What is the single most important ecommerce metric to track?
Conversion rate is generally considered most critical because it directly measures whether your store turns visitors into buyers. However, the “most important” metric depends on your current business goals. A store focused on profitability might prioritize net margin, while a growth-stage store might focus on customer acquisition cost.
How do I track ecommerce metrics on Shopify?
Shopify provides built-in analytics for basic metrics like sales and traffic. For deeper insights like session replays, heatmaps, and behavior-linked conversion data, you’ll want a dedicated analytics app that integrates with your Shopify store and connects behavior to outcomes.
Which ecommerce metrics require daily versus monthly review?
Check traffic, conversion rate, and revenue daily to catch sudden problems. Review CAC, CLV, retention rate, and channel performance monthly to track strategic trends and inform budget decisions.
How do I identify which specific page is hurting my conversion rate?
Use funnel analysis to find where the biggest drop-offs occur, then review heatmaps and session replays for that page. The combination of quantitative data (where) and behavioral data (why) reveals the specific problem.
Why do my mobile and desktop conversion rates differ significantly?
Mobile visitors face different UX challenges: smaller screens, harder navigation, slower perceived load times. Segmenting by device and reviewing mobile-specific session recordings reveals friction points unique to each experience.

Hien Tran
I’m Hien Tran, a Product Marketing Executive at MIDA, specializing in eCommerce growth and conversion optimization. I focus on bridging product capabilities with real merchant needs—turning insights from heatmaps, session replays, and funnel analytics into actionable strategies that drive measurable results.


