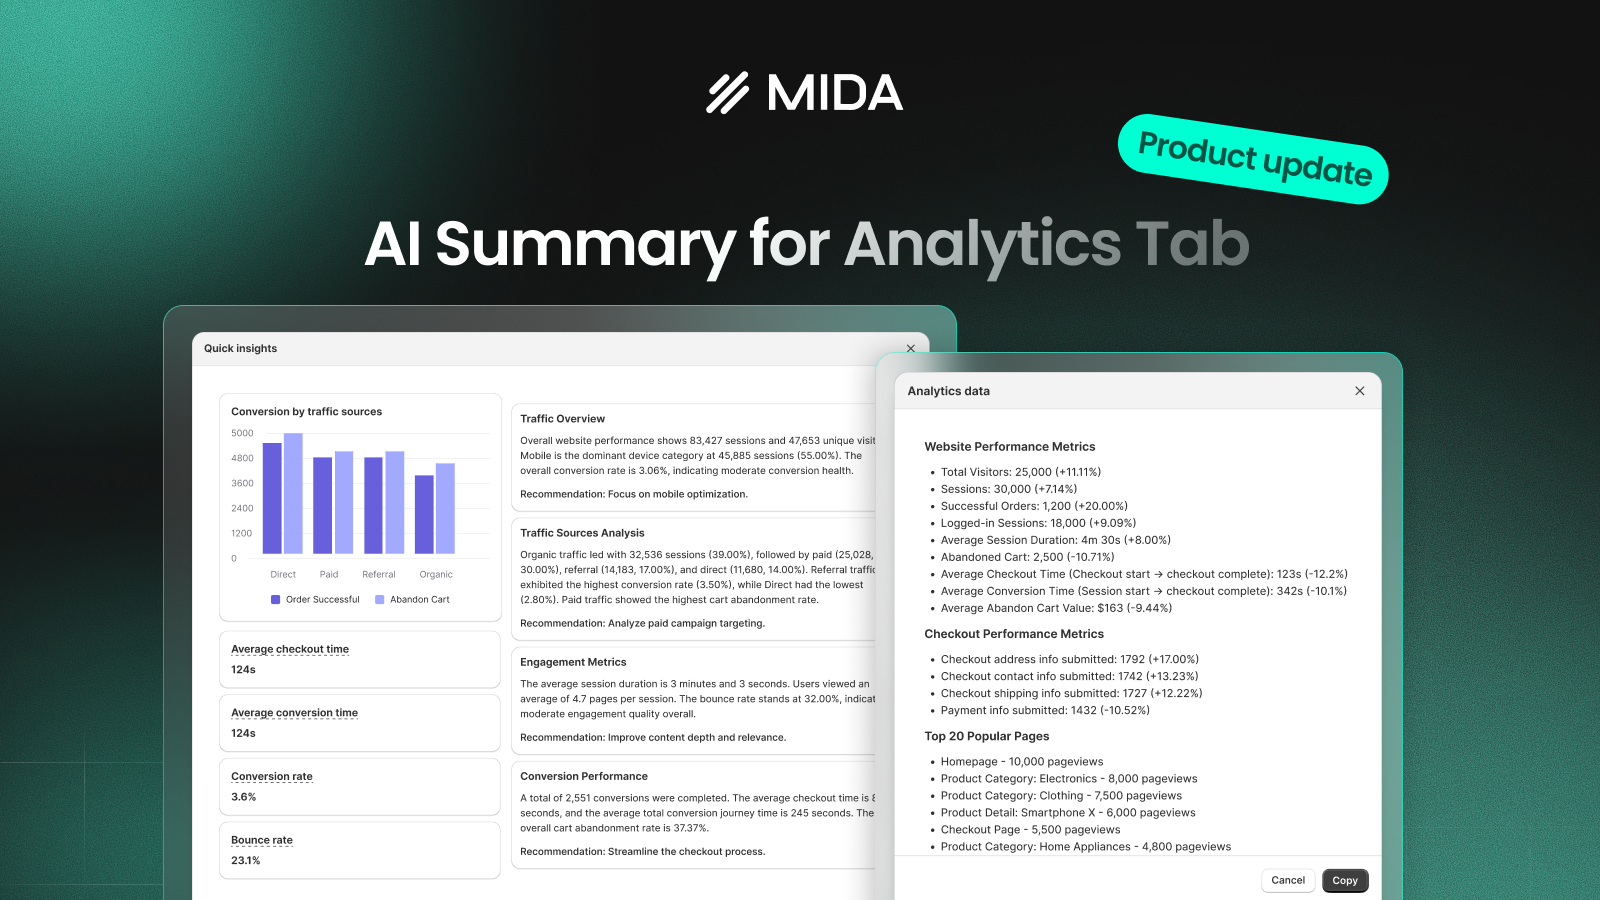

Most analytics dashboards give you numbers — sessions, bounce rates, conversion rates — but turning those numbers into meaningful insights takes time and effort. You either skim through data without clarity or spend hours digging for answers.
The new AI Summary for Analytics tab in MIDA is designed to change that. It helps you instantly understand what’s happening in your store, while still giving you the flexibility to explore deeper when needed.
What is AI Summary for Analytics?
AI Summary provides a clear, human-readable overview of your Analytics data — highlighting the most important insights across traffic, engagement, and conversion.
Instead of switching between multiple reports, you get a concise summary that answers a simple question:
“How is my store performing right now — and where should I look next?”
Alongside this, the Copy feature allows you to export your full Analytics dataset in a structured format, making it easy to analyze further or use with external tools.
AI Summary: Understand Your Store in Seconds
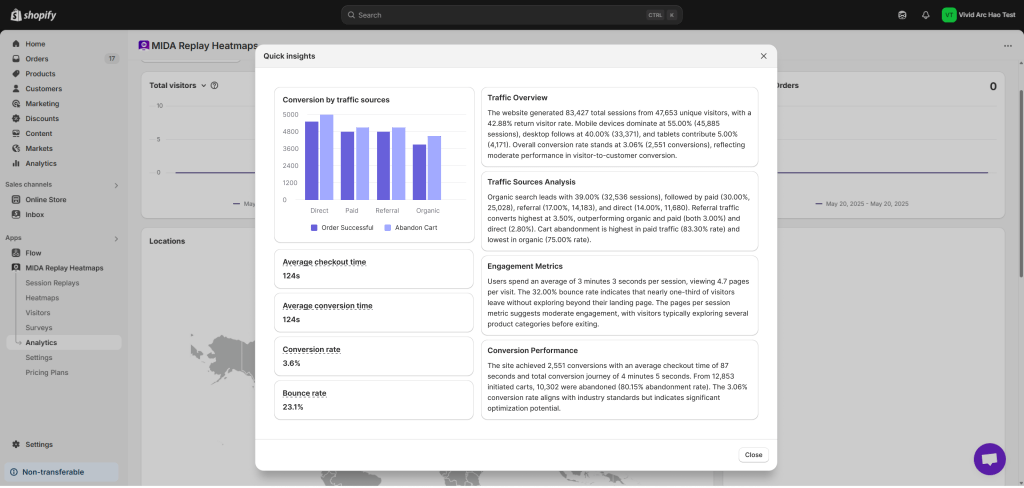
To access this feature, go to Analytics → click “Quick Insight”.
A summary modal will appear, breaking down your store performance into four key sections:
Traffic Overview
Get a high-level snapshot of your store:
- Total sessions and visitors
- Device distribution (mobile, desktop, tablet)
- Overall conversion rate
This helps you quickly understand how much traffic you’re getting and where it comes from.
Traffic Sources Analysis
Understand the quality of your acquisition channels:
- Organic, Paid, Referral, Direct traffic
- Conversion rate by source
- Cart abandonment comparison
For example, you might notice that paid traffic brings volume but has higher abandonment — a clear signal to review your landing pages or targeting.
Engagement Metrics
Evaluate how users interact with your store:
- Average session duration
- Pages per session
- Bounce rate
These metrics show whether visitors are engaged or leaving too early.
Conversion Performance
Focus on what drives actual results:
- Total conversions
- Average checkout time
- Conversion journey time
- Cart abandonment rate
This connects user behavior directly to revenue outcomes and helps you identify bottlenecks in your funnel.
In simple terms, AI Summary turns raw data into a clear story — so you can move from reading numbers to understanding what they mean.
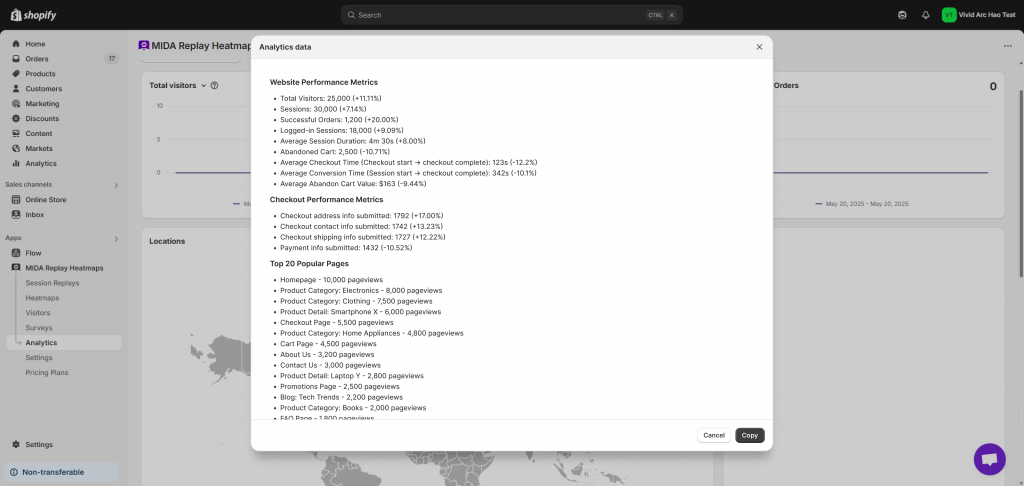
Copy Analytics Data for Deeper Analysis
For users who want to go beyond the summary, the Copy button allows you to export your full Analytics data in a structured format.
The exported data includes:
- Website Performance Metrics
- Checkout Performance Metrics
- Top 20 Popular Pages
- Top 20 Viewed Products
- Top 20 Ordered Products
- Top 20 Abandoned Products
- Funnel actions (view → add to cart → checkout → purchase)
- Country distribution
- Browser breakdown
- Device & operating system data
This makes it easy to:
- Share insights with your team
- Run deeper analysis
- Paste data into tools like ChatGPT for advanced recommendations
For example, you can ask:
- “What are the biggest conversion bottlenecks?”
- “How can I improve checkout performance?”
- “Which products should I prioritize?”
How to Use This Feature in MIDA
- Go to Analytics
- Click Quick Insight to view AI Summary
- Click Copy to export full Analytics data
This gives you both speed and depth — depending on your needs.
Key Use Cases
- Get instant clarity: Quickly understand store performance without digging through multiple reports.
- Identify problems faster: Spot high bounce rates, weak traffic sources, or checkout friction early.
- Analyze data with AI tools: Export your data and use external tools for deeper insights and recommendations.
- Improve team collaboration: Share structured analytics data across marketing, product, and growth teams.
- Make faster decisions: Reduce analysis time and focus on what actually drives results.
Built for Real Shopify Stores
Designed for Shopify and Shopify Plus merchants, this feature works seamlessly with your existing Analytics data. Combined with MIDA’s heatmaps, session replay, and funnel tracking, you get a complete view of your store — from high-level insights to detailed behavior.
In summary, AI Summary for Analytics helps you stop getting lost in data and start making faster, smarter decisions. Whether you need a quick overview or deep analysis, MIDA gives you the clarity to act with confidence.


