Revenue per Session: What It Is, How to Calculate It, and Why It Matters in 2026
Revenue per session (RPS) measures the average revenue your store generates from each visit, calculated by dividing total revenue by total sessions. It’s the single metric that combines traffic quality, conversion rate, and order value into one number—telling you how efficiently your store turns visits into money.
This guide covers how to calculate RPS, what benchmarks actually mean for your store, the most common reasons sessions fail to generate revenue, and how to diagnose the specific friction points dragging your number down.
What is revenue per session
Revenue per session (RPS) measures the average revenue generated from a single visit to your store. You calculate it by dividing total revenue by total sessions over a given time period. The metric captures your store’s monetization efficiency in one number, combining traffic quality, conversion rate, and order value into a single view of how well each visit translates to money.
A session is one visit to your store, typically ending after a period of inactivity or at midnight. Every session counts in the denominator, whether the visitor buys or not. So if your store generated $15,000 from 5,000 sessions last month, your RPS is $3.00.
That $3.00 represents what each visit was worth on average, even though most visitors didn’t purchase anything. The metric accounts for both buyers and browsers, which is what makes it useful for measuring overall store performance rather than just conversion.
How to calculate revenue per session
Revenue per session formula
The math is simple:
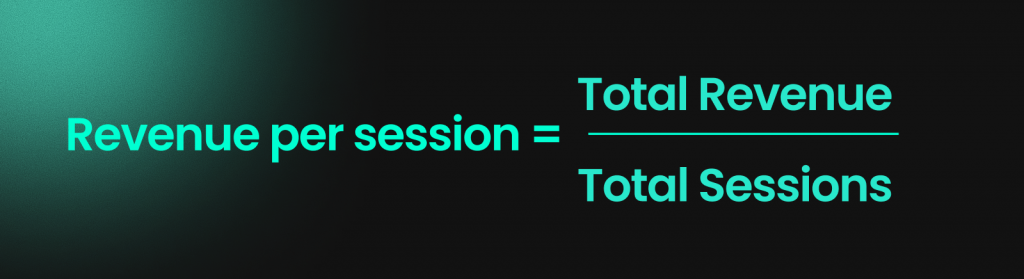
Revenue per Session = Total Revenue ÷ Total Sessions
Take your total revenue for a period and divide by the number of sessions during that same period. The result tells you what each visit was worth on average.
Worked calculation example
Picture a Shopify store that generated $24,000 in revenue last month from 8,000 sessions. Divide $24,000 by 8,000, and you get an RPS of $3.00.
Now imagine a second store that generated $24,000 from 12,000 sessions. Same revenue, but RPS drops to $2.00. The second store needs more traffic to generate the same money, which means it’s less efficient at turning visits into revenue.
Common calculation mistakes
A few pitfalls can throw off your RPS:
- Mixing sessions with users: One person can visit your store three times, creating three sessions. Use sessions, not unique visitors, for RPS.
- Excluding non-converting traffic: Every session goes in the denominator, including visitors who bounced immediately. RPS measures efficiency across all traffic.
- Inconsistent refund handling: Decide whether you’re using gross revenue or net revenue, then stay consistent across all time periods.
- Mismatched time periods: If your revenue data covers Monday through Sunday but your session data covers Tuesday through Monday, your RPS will be wrong.
Why revenue per session matters for ecommerce
RPS combines three factors into one metric: traffic volume, conversion rate, and average order value. It tells you how well your store monetizes each visit, regardless of where that traffic comes from.
Consider two stores with identical traffic of 10,000 sessions each. Store A has a 2% conversion rate with a $50 average order value, generating $10,000 total (RPS of $1.00). Store B has a 1% conversion rate with a $120 average order value, generating $12,000 total (RPS of $1.20). Same traffic, different efficiency.
This is why RPS works well for prioritizing optimization work. You can break it down by traffic source to see which channels bring visitors who actually buy. You can track it before and after design changes to see if improvements translate to more revenue per visit. And you can use it to focus on pages or flows where sessions lose the most value.
Revenue per session vs related metrics
Revenue per session vs conversion rate
Conversion rate measures the percentage of sessions that result in a purchase. It tells you how often visitors buy, but it ignores how much they spend.
A store with a 3% conversion rate and $40 average order value has the same RPS as a store with a 2% conversion rate and $60 average order value. Conversion rate alone would make the first store look better, but both generate identical revenue per session.
Revenue per session vs average order value
Average order value (AOV) only looks at buyers. It’s total revenue divided by number of orders, so it excludes all the sessions that didn’t convert.
RPS includes everyone. You can have a high AOV but low RPS if your conversion rate is poor. A store selling $200 products with a 0.5% conversion rate has an RPS of $1.00, while a store selling $50 products with a 4% conversion rate has an RPS of $2.00.
Revenue per session vs revenue per visitor
Revenue per visitor (RPV) uses unique visitors instead of sessions. Since one visitor can return multiple times, creating multiple sessions, RPV and RPS will differ.
Use sessions when you’re optimizing the visit-level experience, like page layouts and checkout flows. Use visitors when you’re thinking about audience-level questions like customer lifetime value or acquisition costs.
| Metric | Formula | What it measures |
|---|---|---|
| Revenue per session | Revenue ÷ Sessions | Revenue efficiency per visit |
| Conversion rate | Orders ÷ Sessions | Purchase frequency |
| Average order value | Revenue ÷ Orders | Spend per buyer |
| Revenue per visitor | Revenue ÷ Unique visitors | Revenue efficiency per person |
Revenue per session benchmarks by industry
RPS varies widely depending on what you sell, your price points, and your traffic mix. Your own historical trend matters more than hitting someone else’s number.
Fashion and apparel
Fashion stores typically see moderate RPS due to mid-range order values and impulse purchase behavior. Seasonality and promotions heavily influence this vertical, so expect RPS to spike during sales events and dip during off-seasons.
Health and beauty
Repeat purchases and subscription models can lift RPS over time in this category. Individual order values tend to be lower, but purchase frequency often compensates.
Electronics and home goods
Higher-ticket items mean fewer conversions but larger order values when they happen. A store selling $500 products with a 1% conversion rate can match the RPS of a store selling $50 products with a 10% conversion rate.
Food and beverage
Consumables have lower average order values, but bundles and repeat buyers can drive strong RPS. Subscription models particularly help in this vertical.
Rather than chasing industry benchmarks, track your own RPS week over week. A 10% drop signals something changed, regardless of where you sit relative to competitors.
Common causes of low revenue per session
High bounce rate and poor landing pages
Visitors who leave immediately contribute zero revenue but still count as sessions. Every bounce drags down your RPS.
This often happens when ad messaging doesn’t match landing page content. A shopper clicks an ad for “summer dresses” and lands on a generic homepage. They leave, and your RPS suffers.
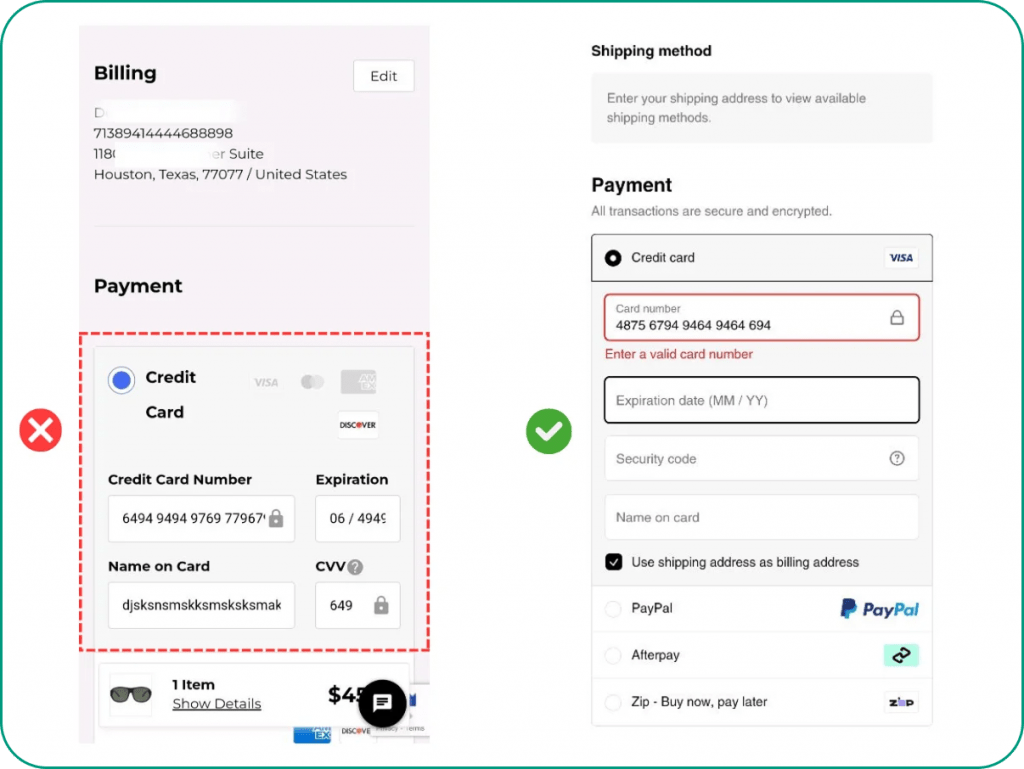
Cart abandonment and checkout friction
Shoppers who add items but don’t complete purchase represent lost RPS. They showed buying intent, then something stopped them – a pattern reflected in industry cart abandonment rates. They showed buying intent, then something stopped them.
Common checkout friction points include unexpected shipping costs appearing at checkout, complex forms requiring too much information, and missing trust signals near the payment button.
Low average order value
Even with decent conversion rates, small orders keep RPS low. If visitors are buying but only purchasing single items at low price points, your revenue per session stays flat.
Missed upsell and cross-sell opportunities often cause this. A shopper buys one item when they might have bought three with the right prompts.
Traffic quality issues
Not all traffic is equal. Low-intent visitors, like —bots, misaligned paid campaigns, or broad social reach, inflate your session count without generating revenue —are common conversion killers that inflate your session count without generating revenue.
If your paid campaigns target too broadly, you might be paying for sessions that were never going to convert. Your RPS will reflect that inefficiency.
How to diagnose low revenue per session
Segment by traffic source
Break your RPS down by channel: organic search, paid ads, social, email, direct. You’ll often find dramatic differences.
Organic search might deliver $4.50 RPS while paid social delivers $0.80. That gap tells you where to focus optimization efforts and where to reconsider your ad spend.
Segment by device type
Compare RPS across desktop, mobile, and tablet. A significant gap between desktop and mobile RPS usually signals mobile-specific UX problems.
If mobile visitors convert at half the rate of desktop visitors despite similar traffic volumes, your mobile experience is likely costing you revenue.
Analyze funnel drop-off points
Map where sessions lose valueMap where sessions lose value across your conversion funnel: product page → add to cart → checkout → purchase. Each step has a drop-off rate, and the biggest drops indicate where to focus.
A 60% drop between “add to cart” and “checkout initiated” suggests different problems than a 40% drop between “payment info” and “purchase complete.”
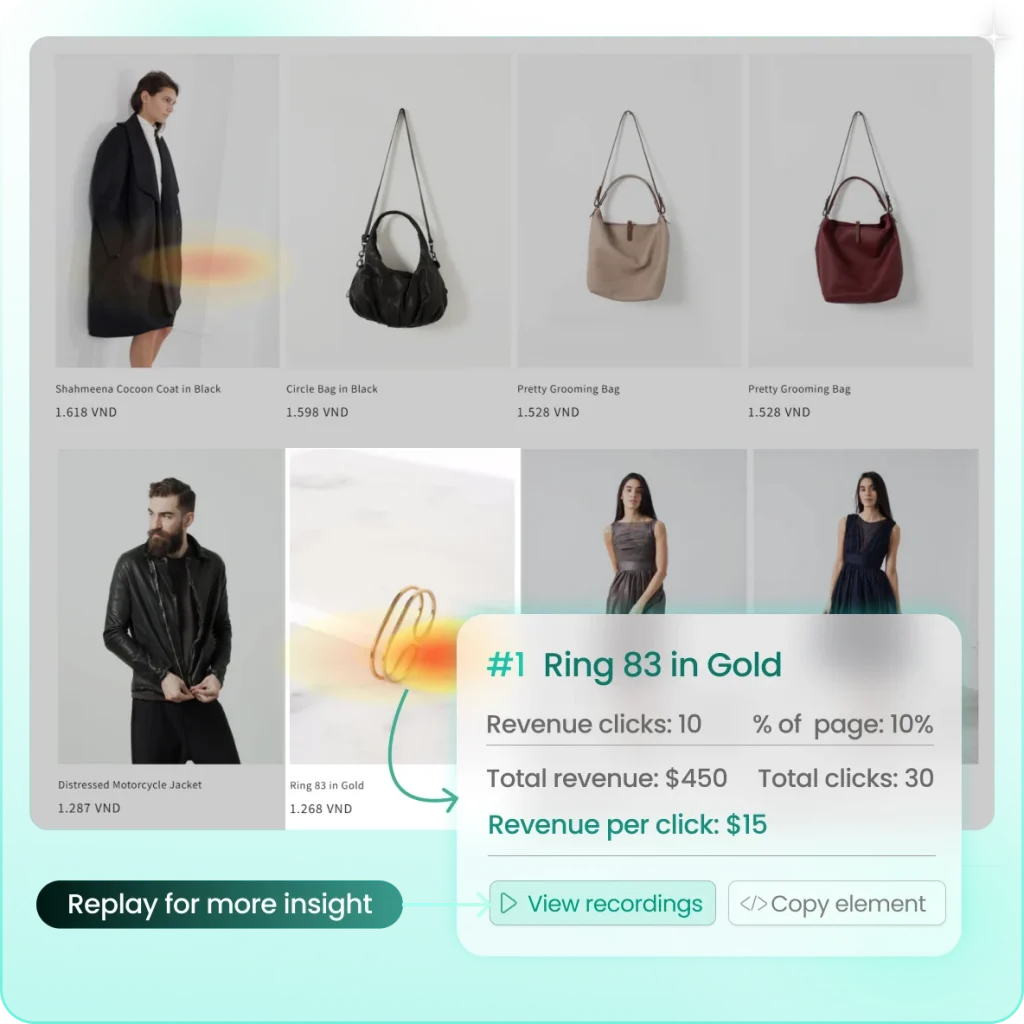
Review session replays and heatmaps
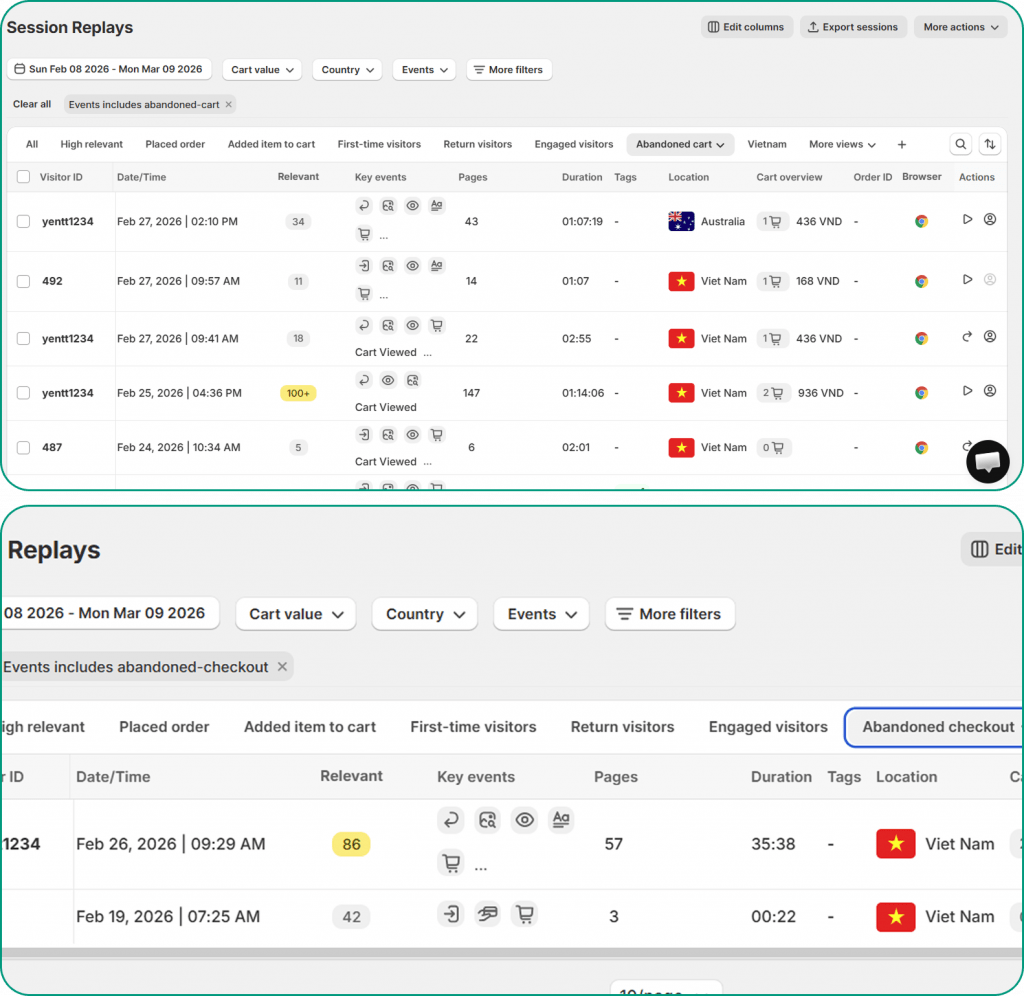
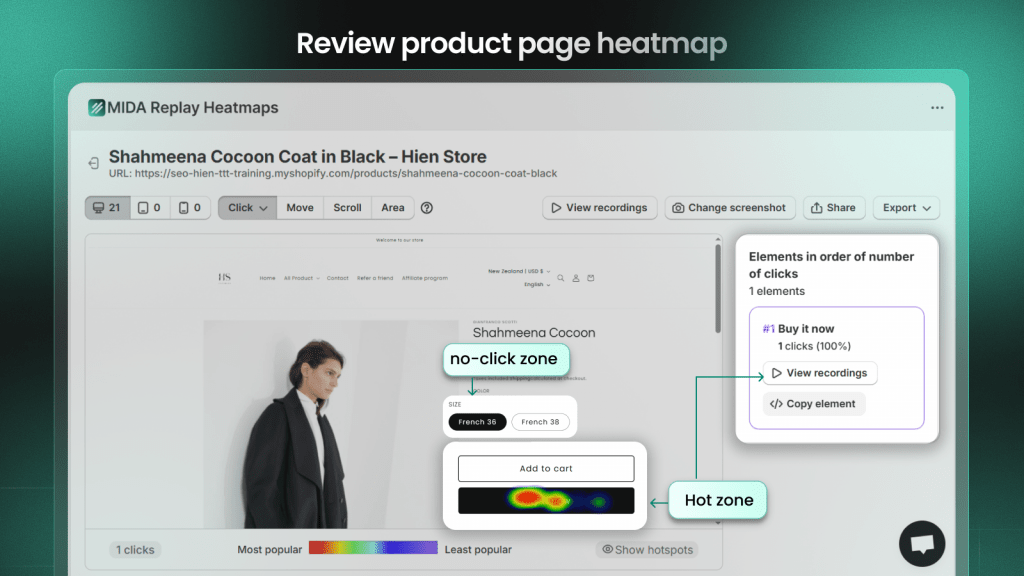
Aggregate data shows where drop-offs happen. Session replays and heatmaps show why.
Watching real sessions reveals confusion, hesitation, and rage clicksWatching real sessions reveals confusion, hesitation, and rage clicks that numbers alone miss. Tools like MIDA connect behavior to Shopify orders, so you can watch the exact session behind an abandoned cart and see what went wrong or run a heatmap analysis to see what went wrong.
Strategies to improve revenue per session
1. Reduce checkout friction
Simplify forms, show shipping costs early, and add trust signals near the payment button. Every completed checkout adds directly to RPS—all proven checkout conversion tactics. Every completed checkout adds directly to RPS.
Guest checkout removes a common barrier. Shoppers want to complete a transaction, not commit to creating an account.
2. Increase average order value
Upsells, cross-sells, bundles, and free shipping thresholds all lift order values. Higher orders mean higher RPS even without more conversions.
A “frequently bought together” section or a “spend $15 more for free shipping” prompt can meaningfully increase what each buyer spends.
3. Improve product page experience
Clear images, detailed descriptions, and visible social proof reduce hesitation. When shoppers feel confident about what they’re buying, add-to-cart rates improve.
Missing size guides, unclear product specs, or buried reviews all create friction that lowers RPS.
4. Optimize for mobile sessions
Mobile shoppers often have lower RPS due to UX gaps. Test button sizes, form fields, and page speed on actual devices rather than just browser preview modes.
Given the mobile traffic share most stores see, even modest mobile improvements can meaningfully lift overall RPS.
5. Target higher-intent traffic
Refine ad targeting and SEO to attract visitors more likely to buy. Quality over quantity improves RPS.
A thousand high-intent visitors will generate more revenue than ten thousand casual browsers, and your RPS will reflect that difference.
How to track revenue per session in Shopify
Shopify’s native reports don’t surface RPS directly. You’ll either calculate it manually or use a dedicated analytics tool.
For manual calculation, export your total sales and session count for the same period, then divide in a spreadsheet. Google Analytics can also track RPS if you’ve set up ecommerce tracking and create a calculated metric.
Shopify-native tools like MIDA automate this calculation and connect RPS to behavioral data. Instead of just seeing what your RPS is, you can watch the sessions that are dragging it down.
See where your sessions lose revenue
RPS tells you how efficiently your store turns visits into revenue. Improving it requires seeing where sessions fall short, which pages cause drop-offs, which checkout steps create friction, and which traffic sources bring low-intent visitors.
Move from metrics to behavior: watch real sessions, spot friction, and prioritize fixes based on what actually happens. When you can see the exact moment a shopper abandons, you know what to fix first.
FAQs about revenue per session
What is the difference between revenue per session and revenue per visitor?
Revenue per session divides total revenue by the number of sessions (visits), while revenue per visitor divides by unique visitors. Since one visitor can have multiple sessions, the two metrics will differ. Use sessions for visit-level analysis and visitors for audience-level insights.
What is a good revenue per session for Shopify stores?
A “good” RPS depends on your industry, product prices, and traffic mix. A luxury goods store and a discount accessories store will have very different RPS benchmarks. Focus on improving your own RPS over time rather than chasing external numbers that may not apply to your store.
How often should I monitor revenue per session?
Weekly monitoring catches trends without creating noise from daily fluctuations. Review RPS after any major site change, campaign launch, or promotion. Daily swings are normal, so avoid reacting to short-term noise.
Does revenue per session include refunds?
It depends on whether you use gross or net revenue in your calculation. Either approach works, but stay consistent. If you exclude refunds for one period, exclude them for all periods to ensure accurate comparisons.

Hien Tran
I’m Hien Tran, a Product Marketing Executive at MIDA, specializing in eCommerce growth and conversion optimization. I focus on bridging product capabilities with real merchant needs—turning insights from heatmaps, session replays, and funnel analytics into actionable strategies that drive measurable results.


