Average Order Value Explained: Formula, Benchmarks, and Growth Strategies
Average order value (AOV) measures the average dollar amount customers spend per transaction on your store. It’s calculated by dividing total revenue by the number of orders—and it’s one of the few metrics you can improve without spending more on ads or driving more traffic.
This guide covers the AOV formula with examples, benchmarks by industry, common causes of low order values, and ten proven strategies to increase what customers spend each time they buy.
What is average order value
Average order value (AOV) is an ecommerce metric that tracks the average dollar amount spent each time a customer places an order on a website or mobile app. You calculate it by dividing total revenue by the number of orders. AOV helps you evaluate purchasing habits, measure marketing effectiveness, and refine pricing strategy to maximize revenue per transaction.
Picture a coffee shop owner who wants to know how much the typical customer spends per visit. They’d divide daily revenue by the number of transactions. That’s AOV—and it tells you whether customers are buying just a coffee or adding a pastry and a bag of beans.
The metric focuses on transaction value, not customer value. A single customer might place multiple orders over time, but AOV measures what happens in each individual order. So if someone places three orders, each order contributes separately to your AOV calculation.
How to calculate average order value
The calculation requires only two data points, making it one of the most accessible ecommerce metrics to track.
The AOV formula
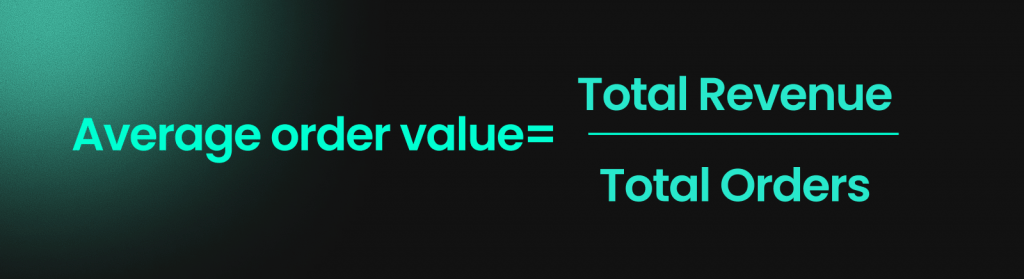
Average Order Value = Total Revenue ÷ Number of Orders
- Total Revenue: The sum of all order values during your measurement period
- Number of Orders: The count of completed transactions during that same period
This formula measures order value specifically, not individual customer value or lifetime spending.
AOV calculation example
Say your Shopify store generated $45,000 in revenue from 600 orders last month. Divide $45,000 by 600, and you get an AOV of $75.
That $75 figure becomes your baseline. The real insight comes from tracking how it changes over time and segmenting it by traffic source, device type, or customer segment to spot patterns worth investigating.
Average order value benchmarks by industry
A “good” AOV varies dramatically depending on what you sell, who you sell to, and how often customers buy. Your own historical data matters more than industry averages, though benchmarks help you understand where you stand relative to similar businesses.
| Industry | Typical AOV Range | Key Factors |
|---|---|---|
| Electronics & Technology | Higher ($150+) | High-ticket items, lower purchase frequency |
| Fashion & Apparel | Moderate ($80–120) | Seasonal variation, accessory bundling |
| Health & Beauty | Moderate ($60–90) | Subscription models, replenishment cycles |
| Food & Beverage | Lower ($30–50) | Higher order frequency, necessity purchases |
Ecommerce AOV benchmarks
General ecommerce benchmarks hover around $70–80, though this number shifts significantly by product price point and purchase frequency. A store selling $15 consumables will naturally have a different AOV than one selling $200 electronics.
Retail and fashion AOV
Fashion tends toward moderate AOV with notable seasonal swings. Bundling accessories—suggesting a belt with pants or a scarf with a coat—often drives meaningful increases in this category.
Health and beauty AOV
Subscription models and replenishment purchases shape AOV patterns here. Consumables like skincare or supplements often show lower per-order values but higher purchase frequency, which changes how you interpret the metric.
Electronics and technology AOV
High-ticket items naturally produce higher AOV, but with lower purchase frequency. Comparing your electronics store’s AOV to a fashion retailer’s creates misleading conclusions.
Food and beverage AOV
This category typically shows lower AOV but higher order frequency. A customer ordering $40 of groceries weekly may be more valuable than one placing a single $150 order annually. Track AOV alongside purchase frequency for the complete picture.
Why AOV matters for ecommerce profitability
Revenue follows a simple formula: Sessions × Conversion Rate × AOV = Revenue. AOV is one of three leversRevenue follows a simple formula: Sessions × Conversion Rate × AOV = Revenue. AOV is one of three levers in your ecommerce conversion funnel you can pull to grow revenue—and unlike traffic acquisition, improving it doesn’t require spending more on ads.
- Revenue growth without more traffic: Increasing AOV means more revenue from visitors you’re already getting
- Better marketing ROI: Higher order values make customer acquisition costs more sustainable
- Improved profitability: Fixed costs like shipping and packaging become smaller relative to order value
Consider two stores with identical traffic and conversion rates. If Store A has a $60 AOV and Store B has a $90 AOV, Store B generates 50% more revenue from the same number of customers.
Common causes of low AOV
Diagnosing why your AOV sits below expectations requires looking at the typical friction points. Each cause suggests a different fix —many of which overlap with common ecommerce conversion killers. Each cause suggests a different fix.
Lack of upselling and cross-selling
Stores without product recommendations miss opportunities to increase cart size. Upselling means suggesting a higher-value alternative, like a premium version of what they’re viewing. Cross-selling means suggesting complementary items, like a phone case when they’re buying a phone.
Without prompts like these, customers buy exactly what they came for—nothing more.
Hidden costs at checkout
Unexpected shipping costs or fees cause customers to remove items or abandon carts entirely. When a shopper sees a $50 subtotal become $62 at checkout, they often reduce their cart to offset the surprise rather than accept the higher total or abandon checkout rather than accept the higher total.
Poor product page experience
Confusing layouts, missing product details, or unclear value propositions prevent customers from discovering and adding more items. If shoppers struggle to understand what they’re looking at, they won’t browse further.
Missing free shipping incentives
Without a free shipping threshold, customers have no motivation to add items beyond their initial intent. A simple “Add $15 more for free shipping” prompt gives them a reason to keep browsing.
Limited payment options
Lack of buy-now-pay-later options like Klarna, Affirm, or Shop Pay Installments can limit higher-value purchases. Customers who can’t comfortably afford a $200 order today might happily place it if they can split payments.
How to diagnose low average order value
Raw AOV numbers tell you what’s happening, not why. Finding the cause requires looking at actual shopper behavior.
- Segment AOV by traffic source: Compare AOV from paid ads versus organic search versus email to spot underperforming channels
- Analyze AOV by device: Mobile versus desktop often reveals UX-driven differences
- Review cart and checkout behavior: Watch where customers hesitate, remove items, or abandon
- Examine product page engagement: Identify which pages lead to single-item versus multi-item orders
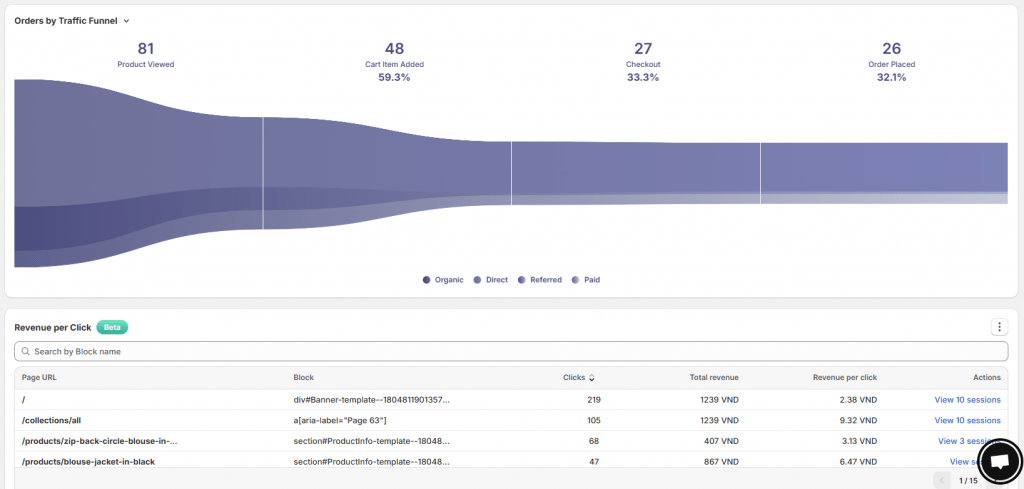
Session replay and heatmap tools let you see exactly where customers drop items or fail to discover complementary products. MIDA connects behavioral data to order outcomes, so you can filter sessions by AOV range and watch what high-value versus low-value customers do differently.
Proven strategies to increase average order value
Each tactic below addresses a specific cause of low AOV. Prioritize based on what your diagnostic work reveals rather than implementing everything at once.
1. Set free shipping thresholds
Setting a minimum order amount for free shipping motivates customers to add items. The sweet spot is typically 15–20% above your current AOV—high enough to drive incremental revenue, low enough to feel achievable.
2. Upsell higher-value products
Show premium versions of products customers are viewing. “Customers also considered” sections featuring upgraded options work well, especially when the price difference feels modest relative to the value gained.

3. Cross-sell complementary items
Suggest related products that make sense together. The key is relevance—a phone case with a phone feels helpful, while random accessories feel pushy. Watch session recordings to see how customers respond to your recommendations.
4. Create product bundles
Package related products together at a slight discount. A skincare “starter kit” often converts better than individual products listed separately because bundles increase perceived value while raising order totals.
5. Optimize product pages for add-to-cart
Clearer product information, better imagery, and visible related products encourage multi-item orders. If customers can’t easily find complementary items, they won’t add them.
6. Offer volume discounts
Tiered pricing structures like “Buy 2, get 10% off” or “Buy 3, get 15% off” encourage larger quantities. This works particularly well for consumables and gift purchases.
7. Use personalized recommendations
AI-powered recommendation engines show relevant products based on browsing history and purchase patterns. Personalized suggestions convert better than generic “bestsellers” lists.
8. Launch a loyalty program
Points or rewards programs incentivize larger purchases. Customers spend more to reach reward thresholds, especially when progress is visible (“You’re $20 away from your next reward”).
9. Apply strategic discounts and promotions
Not all discounts help AOV. Minimum-purchase discounts (“$10 off orders over $75”) increase order value, while blanket percentage-off promotions often reduce it. Choose discount structures that reward larger orders.
10. Add limited-time offers
Urgency-based tactics like time-limited bundles or bonus items motivate customers to buy more now rather than later. “Add this item for 50% off—today only” creates immediate action.
How AI and automation increase AOV
Machine learning identifies patterns humans miss and serves real-time suggestions that adapt to each shopper’s behavior.
- Automated product recommendations: AI analyzes purchase patterns to suggest items with high add-to-cart probability
- Dynamic bundling: Algorithms create personalized bundle offers based on current cart contents
- Predictive upsells: AI identifies which customers are likely to respond to upgrade offers
- Checkout optimization: Automated suggestions at checkout capture last-minute additions
Tools to track and optimize AOV
Different tool categories reveal different aspects of AOV performance.
- Ecommerce analytics dashboards: Track AOV trends over time and by segment
- Session replay tools: Watch real customer journeys to see what drives multi-item orders
- Heatmap analysis: Identify which product page elements lead to add-to-cart actions
- On-site surveys: Ask customers directly what would encourage larger purchases
MIDA combines these capabilities in a Shopify-native platform, connecting behavioral data directly to order outcomes so you can see which interactions lead to higher or lower order values.
How AOV relates to other ecommerce metrics
AOV doesn’t exist in isolation. It connects to and influences other key metrics.
Conversion rate and AOV
Tactics that increase AOV—like higher free shipping thresholds—might reduce conversion rate. A customer who would have placed a $40 order might abandon entirely if the free shipping threshold is $75. Balance both metrics for overall revenue growth.
Customer lifetime value and AOV
Customer lifetime value (CLV) measures total revenue from a customer over their entire relationship with your store. Higher AOV per transaction compounds over time, directly increasing CLV. However, a customer with moderate AOV but high purchase frequency may have higher CLV than one with high AOV but a single purchase.
Average order frequency and AOV
Frequency matters alongside value. A customer spending $30 per order but buying monthly ($360/year) may be more valuable than one spending $150 once ($150/year). Track both metrics together for accurate customer value assessment.
Start optimizing your average order value today
AOV is one of the most actionable ecommerce metrics because it responds directly to changes in your store experience. The formula is simple, benchmarks provide context, and the strategies to improve it are well-established.
The key is diagnosis before tactics. Understanding why your AOV sits where it does—through behavioral data, session recordings, and customer feedback—ensures you fix the right problems first.
See exactly where customers add items, hesitate, or abandon carts—and connect that behavior directly to order data.
FAQs about average order value
Is average order value a KPI?
Yes, AOV is a key performance indicator for ecommerce businesses because it directly measures revenue efficiency. Teams use it to track the impact of pricing changes, merchandising decisions, and promotional strategies over time.
Does average order value include shipping and taxes?
AOV calculations typically use the product subtotal before shipping and taxes. This approach maintains consistency and isolates actual purchasing behavior from variable fulfillment costs that differ by location and shipping method.
How often should you measure average order value?
Most ecommerce teams track AOV weekly or monthly to spot trends without getting lost in daily noise. During promotions or peak seasons, daily monitoring helps you understand how campaigns affect order value in real time.
Can average order value be too high?
An unusually high AOV can indicate you’re attracting only high-spending customers while missing broader market segments. It may also suggest your product mix lacks accessible entry points for new customers who might become loyal buyers over time.

Hien Tran
I’m Hien Tran, a Product Marketing Executive at MIDA, specializing in eCommerce growth and conversion optimization. I focus on bridging product capabilities with real merchant needs—turning insights from heatmaps, session replays, and funnel analytics into actionable strategies that drive measurable results.


