What is a Good Conversion Rate for Ecommerce Stores
A good ecommerce conversion rate typically falls between 2% and 4%, with most stores averaging around 2.5% to 3%. But that number alone doesn’t tell you much—what counts as “good” depends heavily on your industry, traffic sources, and what you’re selling.
This guide breaks down conversion rate benchmarks by industry, device, and traffic source, then walks through how to diagnose what’s dragging your rate down and the specific tactics that move it up.
What is an ecommerce conversion rate
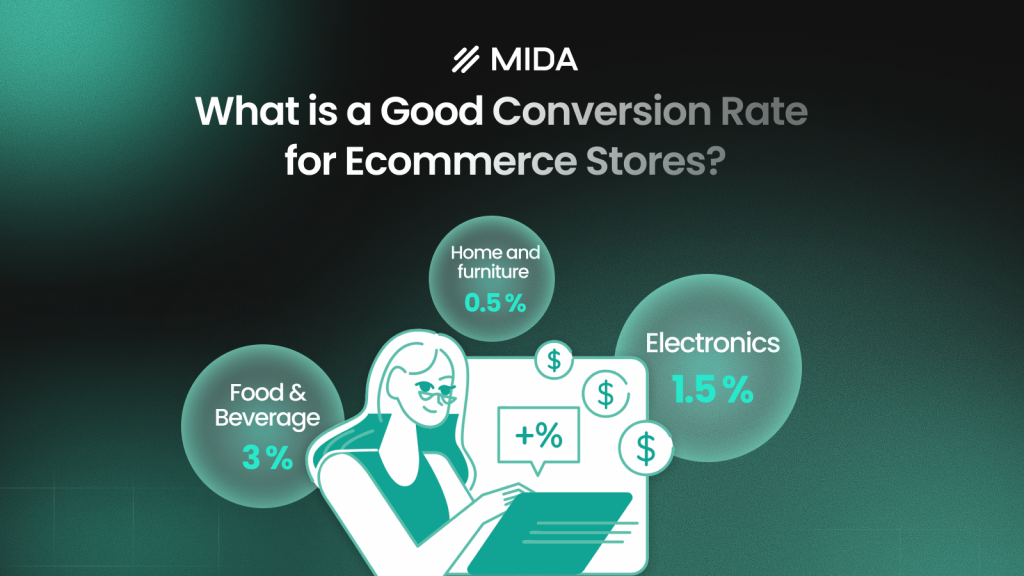
A good ecommerce conversion rate generally falls between 2% and 4%, with the industry average sitting around 2.5% to 3%. Rates vary by sector—food and beverage stores often exceed 3%, while luxury items and furniture frequently convert below 1.5%.
Your ecommerce conversion rate is the percentage of visitors who complete a purchase. The math is simple: divide purchases by visitors, then multiply by 100. So if 3,000 people visit your store this month and 75 buy something, your conversion rate is 2.5%.
This metric reveals how well your store turns browsers into buyers. A low rate doesn’t mean your products are wrong—it often points to friction somewhere in the shopping experience that stops people from finishing their purchase.
What is a good ecommerce conversion rate
The short answer is 2% to 4%, though “good” depends on your context. A 1.5% rate might be excellent for a store selling $2,000 furniture, while 3% could be underperforming for a $15 impulse-buy product.
Top-performing stores sometimes hit 5% to 10%. But chasing those numbers without understanding your own baseline can lead you astray. What matters more is whether your rate improves over time and whether you understand what’s driving it.
Rather than fixating on industry averages, track your own trajectory. If you were at 1.8% last quarter and you’re at 2.2% now, that’s real progress—regardless of what other stores are doing.
Average ecommerce conversion rate by industry
Conversion rates vary dramatically across industries because of differences in price points, purchase complexity, and buyer behavior. Someone buying coffee beans decides differently than someone purchasing a sofa.
| Industry | Typical Conversion Rate |
|---|---|
| Food and beverage | 3.0% – 4.5% |
| Health and beauty | 2.5% – 3.5% |
| Fashion and apparel | 1.5% – 2.5% |
| Electronics | 1.5% – 2.5% |
| Home and furniture | 0.5% – 1.5% |
| B2B ecommerce | 1.0% – 2.0% |
Food and beverage
Food and beverage stores typically enjoy the highest conversion rates. Products are consumable, often lower-priced, and frequently purchased on repeat. The buying decision is straightforward—customers already know what they want.
Health and beauty
This sector benefits from brand loyalty and repeat purchasing. Once someone finds a skincare routine or supplement that works, they come back. Lower price points also reduce the barrier to trying something new.
Fashion and apparel
Fashion faces unique challenges. Sizing uncertainty, high return rates, and the visual nature of clothing purchases mean shoppers browse extensively before committing. Many visitors are window shopping rather than actively buying.
Electronics and technology
Higher price points and research-heavy behavior characterize this category. Customers compare specifications across sites, read reviews, and take time before deciding. The conversion rate per visit is lower, but revenue per conversion is typically higher.
Home and furniture
Large-ticket items require significant consideration. Shoppers often visit multiple times before purchasing—measuring their space, consulting partners, or waiting for a sale. This extended decision cycle naturally produces lower rates.
B2B ecommerce
B2B ecommerce operates with fundamentally different dynamics: longer sales cycles, multiple decision-makers, and custom pricing needs. A “conversion” might mean a quote request rather than an immediate purchase.
Average ecommerce conversion rate by device
The device your visitors use significantly impacts whether they complete a purchase. This reflects different browsing contexts and levels of purchase intent.
Desktop conversion rates
Desktop users typically convert at around 3% to 4%. These visitors are often in a focused buying mindset, sitting at home or work with time to complete a purchase. Larger screens make product comparison easier, and typing payment details is less frustrating.
Mobile conversion rates
Mobile rates usually fall between 1.5% and 2.5%—noticeably lower than desktop. Mobile shoppers often browse casually, maybe during a commute or while watching TV. Checkout friction is higher too: small keyboards, autofill issues, and complex forms all create barriers.
This gap represents a real opportunity. If most of your traffic comes from mobile but your conversion rate there is half of desktop, improving the mobile experience could have an outsized impact on revenue.
Tablet conversion rates
Tablet behavior tends to mirror desktop more closely, with rates falling somewhere in between. Tablet users often browse from home in a relaxed setting, and the larger screen reduces friction compared to phones.
Average ecommerce conversion rate by traffic source
Where your visitors come from tells you a lot about their likelihood to buy. Someone who clicked an email link behaves very differently from someone who tapped a social media ad.
Email marketing
Email traffic often converts at the highest rates—sometimes 4% to 5% or more. These visitors already know your brand, have opted in to hear from you, and are often responding to a specific offer. They’re warm leads by definition.
Paid search
Visitors from paid search ads, especially product-specific keywords, arrive with clear purchase intent. They searched for something, saw your ad, and clicked. Rates typically range from 2% to 3%, though this varies by keyword specificity.
Organic search
Organic search traffic falls in the mid-range, usually around 2% to 2.5%. These visitors have intent—they searched for something—but they might still be researching rather than ready to buy.
Social media
Social traffic often converts below 1.5%. Many visitors were scrolling casually and clicked out of curiosity rather than purchase intent. They’re discovering your brand, not necessarily shopping.
Direct traffic
Direct visitors—people who typed your URL or used a bookmark—typically show strong conversion rates. They already know your brand and came with purpose, often including returning customers.
Average ecommerce conversion rate by region
Geographic location affects conversion rates in ways that aren’t always obvious. Payment preferences, shipping expectations, and cultural shopping behaviors all play a role.
The UK tends to see slightly higher rates, often around 4%. The US typically falls in the 2% to 2.5% range. Germany and other European markets vary based on local payment method availability and shipping logistics.
If you’re seeing significantly different rates across regions, it’s worth investigating whether local factors—like missing payment options or unclear shipping costs—are creating friction.
How to calculate your ecommerce conversion rate
Understanding how to measure your conversion rate accurately helps you track progress and spot problems.
The ecommerce conversion rate formula
The formula is straightforward:
(Number of purchases ÷ Number of visitors) × 100 = Conversion rate %
If your store had 5,000 visitors last week and 125 purchases, your conversion rate is 2.5%. Most analytics platforms calculate this automatically, but knowing the formula helps you understand what you’re measuring.
What time period to measure
Different timeframes reveal different insights:
- Weekly: Helps you spot short-term issues and measure the immediate impact of changes
- Monthly: Provides a more stable view for tracking optimization progress
- Quarterly: Useful for identifying seasonal patterns and strategic trends
Avoid drawing conclusions from single days unless you have very high traffic. Daily fluctuations can be misleading.
Sessions vs users
Most conversion rate calculations use sessions rather than unique users. A session is a single visit to your site, while a user is a unique individual who might visit multiple times.
This distinction matters because a customer might browse three times before purchasing. Using sessions, that’s one conversion across three sessions. Using users, it’s one conversion from one user. Neither is wrong, but consistency in measurement matters.
Factors that affect ecommerce conversion rates
Several variables influence whether your conversion rate signals strong performance or room for improvement.
Product price point
Higher-priced items naturally convert at lower rates. A $50 purchase requires less deliberation than a $500 one. Customers research more, compare more, and take longer to decide when the stakes are higher.
Purchase type and complexity
Impulse buys convert at higher rates than considered purchases. A fun $20 accessory is an easy yes. A customizable product requiring multiple decisions creates more opportunities for abandonment.
Checkout experience
Friction during checkout directly reduces conversion. Too many steps, mandatory account creation, limited payment options, or unexpected costs at the final stage all cause drop-offs.
>> Explore: How to Calculate and Reduce Your Checkout Abandonment Rate
Site speed and performance
Slow-loading pages cause visitors to leave before they see your products. Every additional second of load time correlates with lower conversion rates.
Trust signals and social proof
Customer reviews, security badges, clear return policies, and professional design all reduce buyer anxiety. First-time visitors especially benefit from reassurance that your store is legitimate.
Common ecommerce conversion rate misconceptions
A few myths can lead merchants in the wrong direction:
- “Higher is always better”: Context matters. A luxury brand with a 1.5% rate and high average order value might be far more profitable than a commodity brand at 3%.
- “Industry benchmarks are targets”: Your own improvement trajectory matters more than hitting an arbitrary average.
- “Overall conversion rate tells the full story”: An aggregate number hides crucial details. Segmenting by device, traffic source, and customer type reveals actionable insights.
- “Low conversion rate means bad products”: More often, a low rate signals UX friction, poor site performance, or unclear messaging—not a lack of product-market fit.
How to improve your ecommerce conversion rate
The following tactics address the most common conversion barriers.
1. Optimize your mobile experience
Test your store on actual phones, not just browser preview modes. Buttons large enough to tap accurately, readable text without zooming, and smooth navigation on small screens all reduce mobile friction.
2. Reduce checkout friction
Fewer steps, guest checkout options, and progress indicators all help. Every additional field or page is an opportunity for abandonment.
3. Improve site speed
Compress images, remove unused apps, and implement lazy loading for content below the fold. Speed improvements often produce immediate conversion gains.
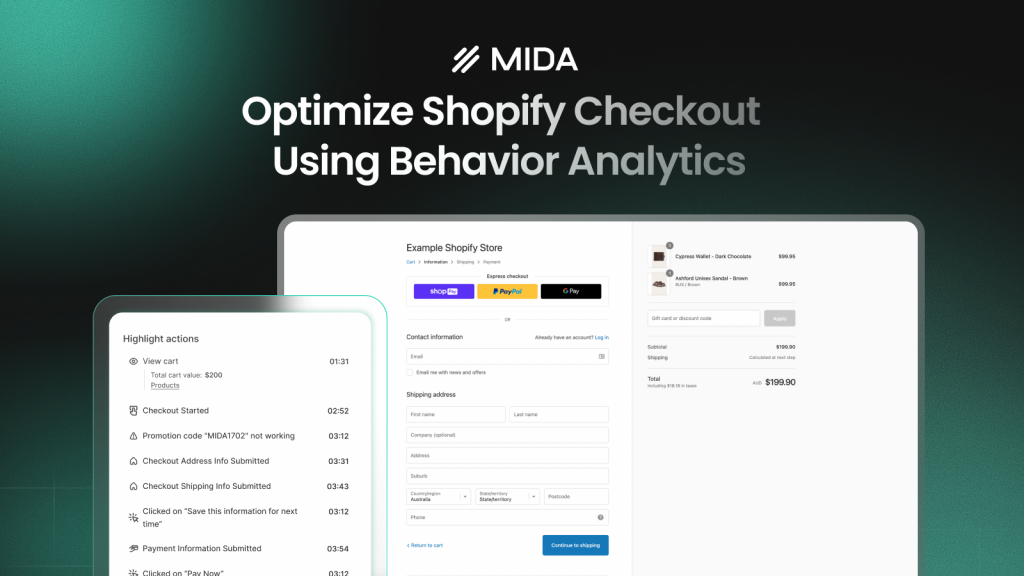
4. Use behavior analytics to find friction points
Watch how real shoppers interact with your store to identify where they struggle. Session replays and heatmaps show exactly where customers get stuck—whether they’re rage-clicking a broken button or abandoning a confusing checkout step. MIDA’s Shopify-native session replay and heatmap tools surface friction signals like rage clicks and dead clicks, then let you jump directly into the recording to see what happened.
5. Add trust signals and social proof
Display customer reviews, security badges, and clear return policies prominently on product pages and during checkout.
6. Recover abandoned carts
Automated email sequences reminding shoppers about items they left behind—with product images and a clear call-to-action—bring visitors back to complete purchases.
7. Improve product page quality
High-quality images, detailed descriptions, size guides, and Q&A sections answer questions directly on the page, reducing reasons to leave.
8. Simplify navigation and filtering
Clear categories, robust filters, and effective on-site search help shoppers find products quickly. If finding a product requires more than three clicks, restructuring may help.
How to diagnose why your conversion rate is low
Instead of guessing what to fix, use data to find specific problems.
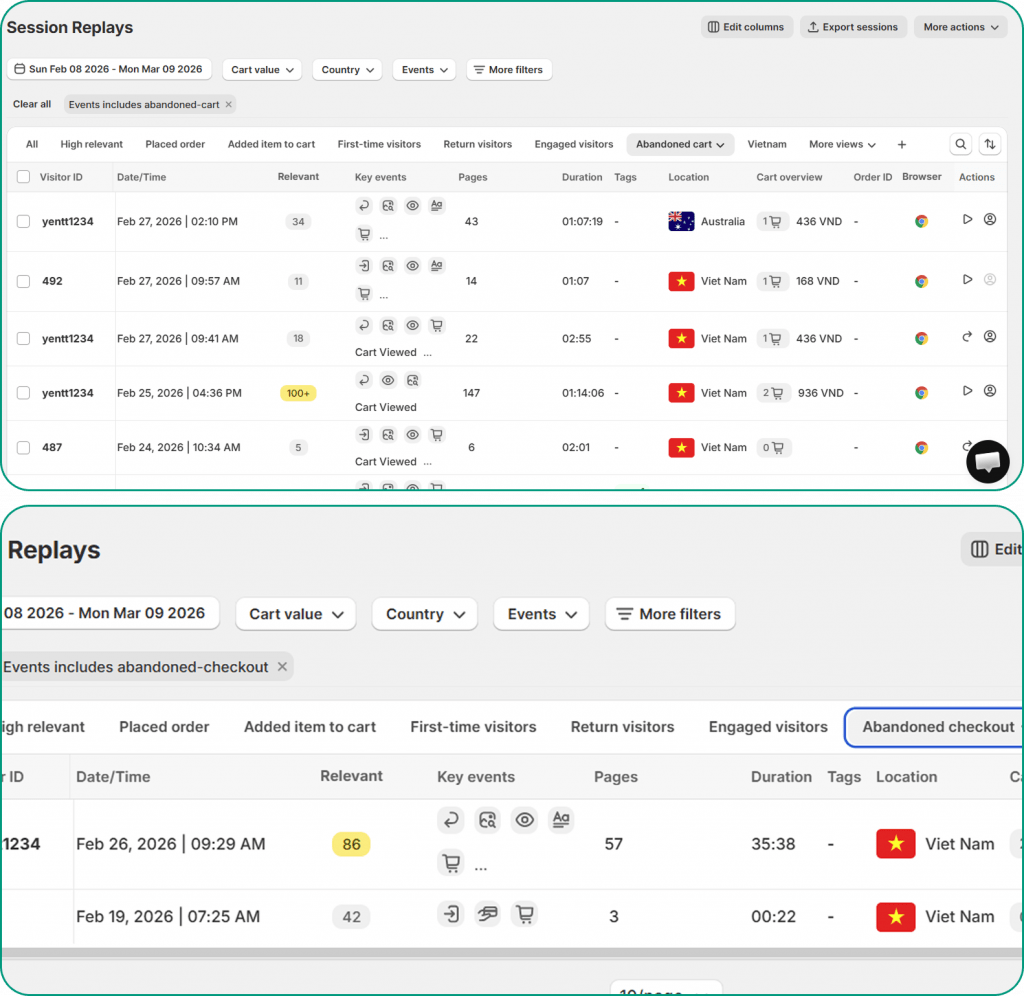
Watch real customer journeys with session replays
Session replays let you see exactly what a shopper experienced—where they paused, what confused them, and when they left. This reveals friction that aggregate analytics can’t show. MIDA Session Replay adds commerce context to recordings, including cart value and checkout steps, so you can prioritize sessions with the most revenue impact.
Analyze heatmaps for engagement patterns
Heatmaps visualize where visitors click, scroll, and hover. Dead clicks (clicks on non-clickable elements) and rage clicks (rapid, frustrated clicking) are clear signals of UX problems.

Review your checkout funnel for drop-offs
Identify which step loses the most shoppers. A funnel visualization shows precise drop-off points from product view to purchase confirmation, helping you focus optimization where it has the biggest impact.
Identify frustration signals
Rage clicks, repeated form corrections, and erratic scrolling all indicate user frustration. Filtering sessions by frustration signals helps you quickly find and fix the issues causing them.
Turn conversion rate benchmarks into revenue growth
Benchmarks give you a starting point, but real growth comes from understanding your own customers’ behavior. The gap between knowing your conversion rate and understanding why it is what it is—that’s where the opportunity lives.
Quantitative metrics tell you what’s happening. Behavioral analytics tell you why. When you can watch a real shopper struggle with your checkout flow or see that nobody scrolls past your product description, you stop guessing and start fixing.
FAQs about ecommerce conversion rates
Is a 2.5% conversion rate good for ecommerce?
A 2.5% conversion rate falls within the typical average range for most ecommerce stores. Whether it’s “good” for your specific business depends on your industry, traffic quality, and product type, but it’s a solid benchmark to build from.
What is a good checkout conversion rate?
Checkout conversion rate—the percentage of shoppers who start checkout and complete their purchase—is typically much higher than overall site conversion rate, often 40% to 60%. Improving this specific metric often has the biggest immediate impact on revenue.
How do seasonal trends affect conversion rates?
Conversion rates typically fluctuate throughout the year, peaking during major shopping events like Black Friday and holidays, then dipping during off-peak periods when purchase urgency is lower.
Where can I find my conversion rate in Shopify?
You can view your store’s conversion rate in your Shopify Analytics dashboard under the “Overview” report. For more detail, check the “Online Store Conversion” report, which breaks down the funnel from sessions to completed purchases.
>> Read more: 15 Proven Ways to Improve Shopify Conversion Rate in 2026

Hien Tran
I’m Hien Tran, a Product Marketing Executive at MIDA, specializing in eCommerce growth and conversion optimization. I focus on bridging product capabilities with real merchant needs—turning insights from heatmaps, session replays, and funnel analytics into actionable strategies that drive measurable results.


