15 Proven Ways to Improve Shopify Conversion Rate in 2026
Your Shopify store gets traffic, but visitors leave without buying. The gap between sessions and sales is where revenue disappears—and most analytics dashboards won’t tell you why.
This guide covers 15 proven tactics for improving your Shopify conversion rate, from behavior-first diagnostics like session replays and heatmaps to practical fixes for checkout friction, mobile experience, and trust signals.
What is Shopify conversion rate optimization
Shopify conversion rate optimization (CRO) is the practice of increasing the percentage of store visitors who complete a purchase. Instead of focusing solely on driving more traffic, CRO improves the shopping experience and removes friction—slow page loads, confusing navigation, checkout complexity, or missing trust signals like reviews and clear return policies.
You already have visitors. The goal is converting more of them into paying customers by analyzing behavior data, identifying friction points, testing improvements, and measuring results.
How to calculate your Shopify store conversion rate
The formula is straightforward: (Number of Orders ÷ Total Sessions) × 100 = Conversion Rate %. If your store had 5,000 sessions last month and 150 orders, your conversion rate would be 3%.
You can find this data in your Shopify Analytics dashboard under “Online store conversion rate.” For deeper context, tools like MIDA’s analytics dashboard surface this metric alongside behavioral signals—showing not just the number, but the patterns behind it.
Track your conversion rate over time rather than fixating on a single snapshot. Daily fluctuations are normal, but weekly and monthly trends reveal whether your optimization efforts are working.
What is a good conversion rate for Shopify stores
“Good” varies widely by industry, traffic source, and product type. Generic benchmarks often mislead more than they help—a store selling $20 consumables will naturally convert at a different rate than one selling $500 electronics.
Several factors influence what counts as good for your store:
- Traffic quality: Paid ads, organic search, and direct traffic all convert at different rates. Cold traffic from prospecting campaigns typically converts lower than warm traffic from retargeting.
- Product price point: Higher-ticket items usually see lower conversion rates because customers take longer to decide.
- Industry vertical: Fashion, electronics, and consumables each have different baseline expectations.
The most effective approach is benchmarking against your own historical performance. If your conversion rate was 2.1% last quarter and it’s 2.4% this quarter, that’s meaningful progress.
>> Explore: 2026 Ecommerce Conversion Funnel Benchmarks and Statistics
Why your Shopify conversion rate is low
Many merchants know their conversion rate is low but can’t pinpoint exactly why. This frustration typically stems from the gap between seeing aggregate numbers in analytics and understanding the actual customer behaviors driving those numbers.
Common causes include:
- Slow page load times: Visitors leave before the page fully renders.
- Confusing navigation: Shoppers can’t find products quickly and give up.
- Checkout friction: Too many form fields, forced account creation, or limited payment options deter buyers.
- Lack of trust signals: Missing reviews, unclear return policies, or absent security badges make shoppers hesitant.
- Poor mobile experience: Buttons too small to tap, text hard to read, or layouts that don’t adapt to smaller screens.
- Unclear value proposition: Visitors don’t immediately understand why they’d buy from you instead of a competitor.
Diagnosing the real cause requires seeing how actual shoppers behave on your site—not guessing based on aggregate data.
15 proven ways to increase your Shopify conversion rate
The following tactics cover both diagnostic methods for understanding what’s broken and practical fixes for implementing changes. We’ll start with behavior-first approaches because gaining visibility into customer actions is crucial before optimizing blindly.
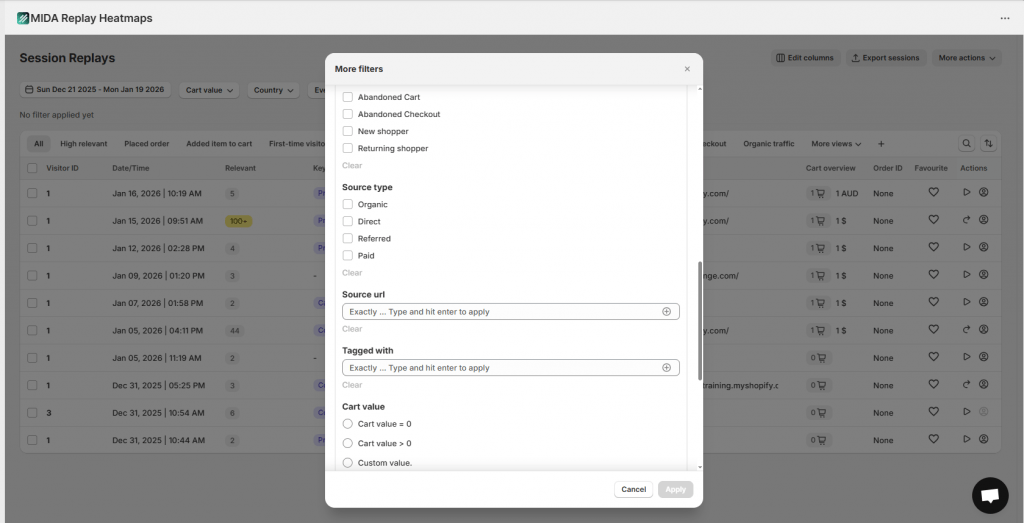
1. Watch real customer sessions to find hidden friction
Session replays are recordings of actual visitor journeys on your store, showing every click, scroll, hesitation, and rage click. A rage click is when a visitor clicks repeatedly on an element out of frustration—often because something isn’t working as expected.
Session replays reveal friction points you’d never find in aggregate analytics. For example, you might discover visitors repeatedly clicking a non-clickable element they assume is a button, or hesitating for 30 seconds on your shipping information before abandoning.
When watching replays, look for rage clicks on unresponsive elements, repeated form field corrections, long pauses before checkout abandonment, and back-and-forth navigation between pages. A Shopify-native tool like MIDA’s session replay links recordings directly to specific carts and orders, so you can watch exactly what happened before an abandoned checkout or completed purchase.
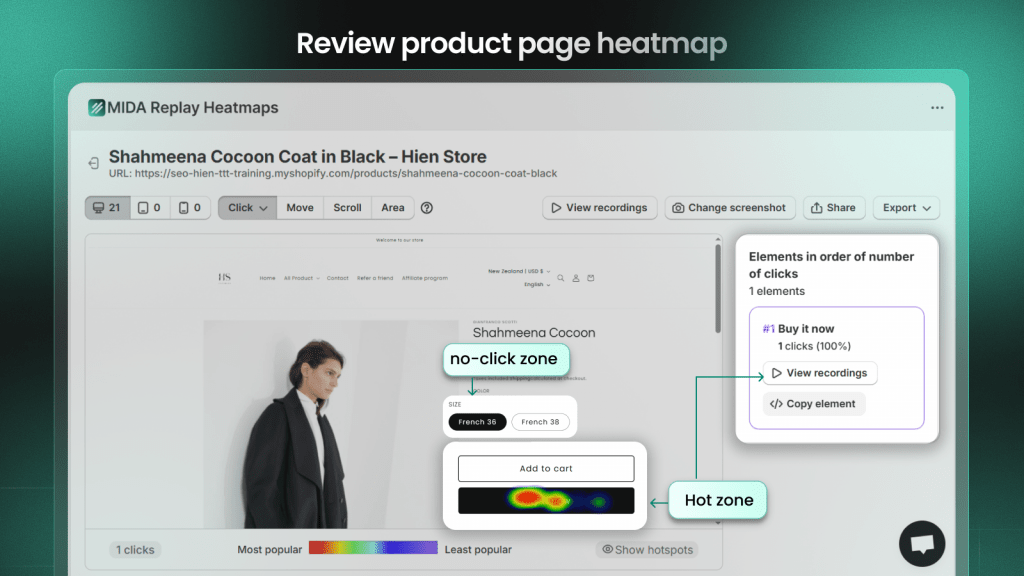
2. Use heatmaps and scroll maps to see what gets ignored
Heatmaps are visual overlays showing where visitors click, move their cursor, and scroll on your pages. A scroll map reveals how far down the page most people actually read—highlighting that content placed below the average fold might be invisible to most visitors.
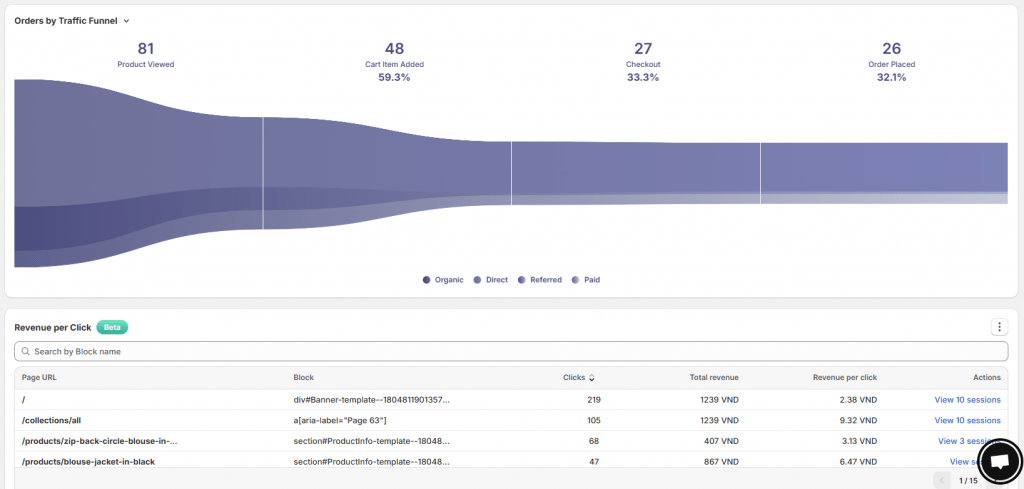
Different heatmap types provide different insights. Click maps show which elements get attention and which are ignored. Scroll maps reveal where most visitors stop scrolling. Move maps indicate areas of visual interest based on cursor movement. Beyond traditional analysis, MIDA takes it further with revenue click heatmaps and conversion heatmaps — helping you see which interactions drive revenue, add-to-cart, and purchases, not just clicks.
Advanced tools like MIDA heatmaps also include dead click and rage click detection. A dead click is when someone clicks an element that does nothing—often indicating they expected it to be interactive.

3. Visualize your order funnel to spot drop-off points
Funnel visualization shows the percentage of visitors who progress through each step of the buying journey: product view → add to cart → checkout → purchase. The goal is identifying which step loses the most shoppers, so you know exactly where to prioritize optimization.
If 40% of visitors who add items to cart never reach checkout, that’s a different problem than if 40% of visitors who start checkout never complete it. The first suggests cart page issues; the second points to checkout friction. MIDA’s order funnel is built for Shopify, showing platform-specific stages and letting you jump directly into session replays of users who dropped off at each point.
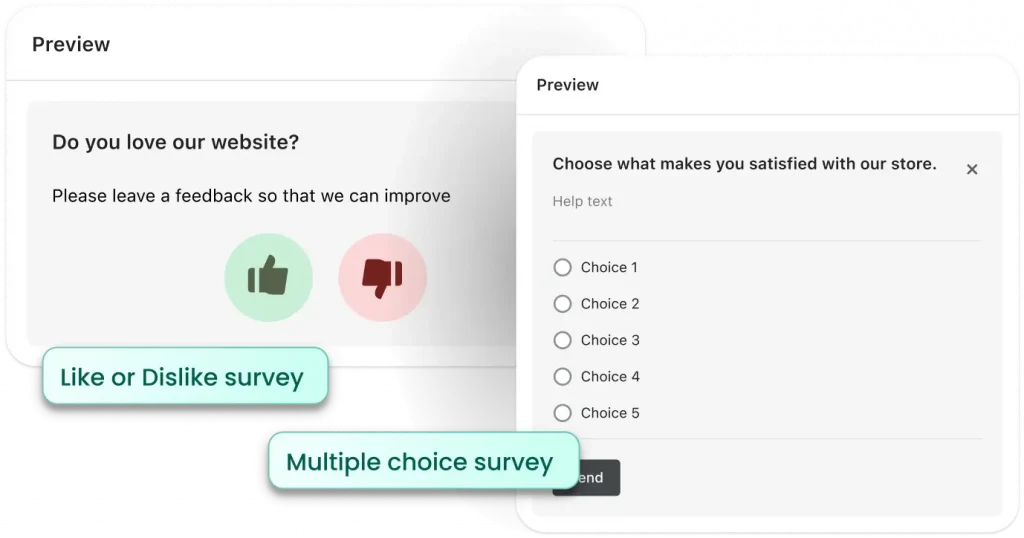
4. Ask customers directly with on-site surveys
While behavioral analytics show what happened, on-site surveys reveal why. You can trigger surveys at specific moments—on exit intent, after purchase, or on underperforming pages.
Powerful survey questions include “What almost stopped you from completing your purchase?”, “What information was missing from this page?”, and “How did you hear about us?” MIDA Survey links responses directly to session replays, combining qualitative feedback with quantitative behavior.
5. Optimize site speed and page load times
The relationship between load time and abandonment is direct. Each additional second of load time increases bounce rates.
Key factors that slow down Shopify stores include app bloat, uncompressed images, and heavy themes. Quick wins include compressing and lazy-loading images, auditing and removing unused Shopify apps running background scripts, minimizing custom code and third-party scripts, and using Shopify’s built-in speed report as a baseline.
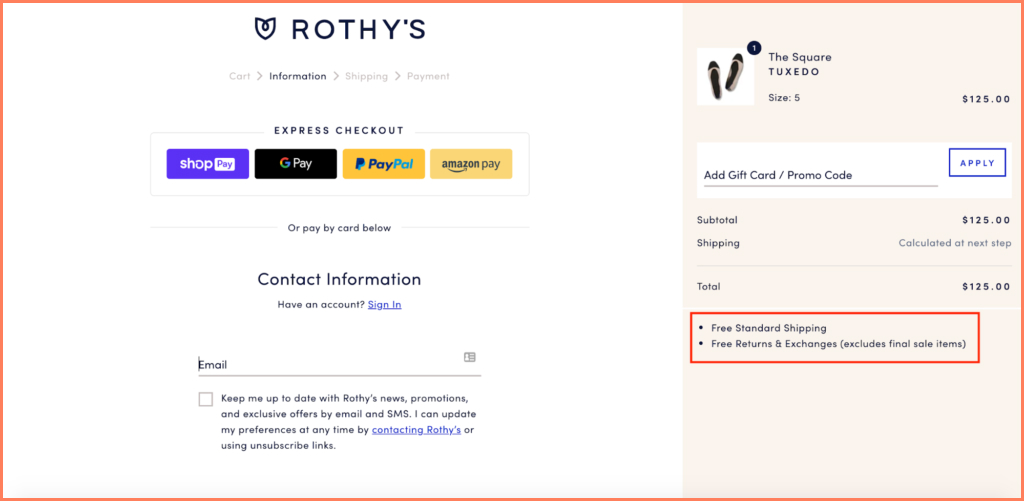
6. Simplify your checkout process
Checkout is often the highest-friction point in the customer journey. Key improvements include enabling guest checkout, reducing form fields, showing a progress indicator, and supporting multiple payment methods like Shop Pay and digital wallets.
Look for checkout friction signals in your analytics and session replays: high abandonment at the shipping information step, repeated attempts to enter payment details, and high exit rates on pages prompting account creation.
7. Recover abandoned carts with email sequences
Abandoned cart recovery involves sending automated emails to shoppers who added items but didn’t complete purchase. For best results, send the first email within an hour, include product images and a clear call-to-action, and consider offering a small incentive.
Understanding why carts are abandoned—by watching session replays—can make your recovery emails more effective. If you notice visitors abandoning after seeing shipping costs, your recovery email might emphasize free shipping thresholds.
8. Improve your mobile shopping experience
The majority of Shopify traffic now comes from mobile devices, making a seamless mobile experience essential.
Perform mobile UX checks regularly: test your store on multiple phone sizes, ensure all buttons are large enough to tap accurately with a thumb, remove interactions that depend on mouse hover, and check that pages load quickly on cellular connections.
9. Make products easy to find with better navigation
Confused visitors leave rather than hunt for products. Improve findability with an intuitive category structure, a prominent search bar with autocomplete, and robust filtering options on collection pages.
Key navigation improvements include organizing collections by how customers think (by use case or benefit) rather than internal categories, adding a prominent search bar with helpful autocomplete suggestions, and implementing filters for attributes like size, color, and price.
10. Upgrade product pages with quality images and details
Your product pages carry the weight of selling. Essentials include multiple high-resolution images from different angles, zoom capability, product videos where appropriate, and benefit-driven descriptions that answer common questions.
Key product page elements include lifestyle images showing the product in use, detailed specifications like size and materials, clear pricing with any discounts highlighted, and a prominent add-to-cart button visible above the fold.
11. Add social proof with reviews and testimonials
Social proof is evidence that other people have purchased from you and are satisfied. This builds trust and reduces purchase anxiety—particularly important for first-time visitors who don’t yet know your brand.
Incorporate trust-building elements: display review count and average star rating prominently, include photo and video reviews when available, show trust badges near the add-to-cart button, and feature testimonials that address common objections.
12. Clarify your value proposition above the fold
Your value proposition is the clear, simple reason someone would buy from you instead of competitors. This message—your unique selling points or key benefits—needs to be visible immediately when visitors land on your homepage, without scrolling.
Your value proposition typically includes a powerful headline communicating your core benefit, supporting points highlighting features like free shipping or warranty, and a visual hierarchy drawing attention to key messages.
13. Offer free shipping or spending thresholds
Unexpected shipping costs are a leading cause of cart abandonment. Mitigate this by offering free shipping above a certain threshold (which can also increase average order value) or providing a predictable flat-rate option.
Display shipping information early in the shopping process—not as a surprise at final checkout.
14. Create urgency with stock and time limits
Scarcity and urgency tactics can motivate hesitant buyers. Low stock indicators, countdown timers for sales, and limited-time offers all work. However, authenticity matters—fake urgency damages trust and harms your brand’s reputation.
Effective urgency elements include “Only X left in stock” notices (when accurate), countdown timers for genuine limited-time sales, and flash sale announcements with clear start and end times.
15. Run A/B tests to validate every change
A/B testing compares two versions of a page or element to see which performs better. To get reliable results, test only one variable at a time, run the test long enough to gather meaningful data, and use data—not opinion—to decide the winner.
Elements worth testing include headlines and value proposition copy, button colors and call-to-action text, product image order and style, and pricing display format.
Best Shopify apps for conversion rate optimization
While apps can accelerate your CRO efforts, choosing the right stack matters. Avoid app bloat, which can slow your store and negatively impact conversions.
| App Category | What It Does | Example Use Case |
|---|---|---|
| Behavior Analytics | Session replay, heatmaps, funnel analysis | Find exactly where visitors abandon checkout |
| A/B Testing | Compare page variations | Test different product page layouts |
| Social Proof | Collect and display reviews and UGC | Showcase photo reviews from customers |
| Checkout Optimization | Streamline purchase flow, add trust elements | Enable one-click post-purchase upsells |
Behavior analytics and session replay apps
Behavior analytics tools show what real visitors do on your site. MIDA is a Shopify-native platform offering order-linked recordings, heatmaps, and surveys in one place—providing context that generic tools often lack.
A/B testing and experimentation apps
A/B testing tools run controlled experiments to validate changes. Ensure your store has sufficient traffic to get meaningful results in a reasonable timeframe before investing heavily here.
Social proof and reviews apps
Social proof apps help collect and display customer reviews, star ratings, and user-generated content to build trust with new visitors.
Checkout optimization apps
Checkout optimization tools focus on streamlining final purchase steps, adding trust badges to checkout, and enabling post-purchase upsells to increase average order value.
How to prioritize Shopify conversion rate optimization efforts
With so many potential changes, knowing where to start matters.
- Start with data: Use session replays and funnel analytics to identify your biggest drop-off point or most common user frustration. That’s your starting line.
- Fix high-traffic pages first: Small improvements on popular pages have outsized impact on overall conversion rate.
- Address checkout friction before top-of-funnel: Leaks near purchase are more costly than awareness-stage issues.
- Test before committing: Validate significant changes with A/B tests rather than redesigning everything based on a hunch.
If you lack internal resources, agencies specializing in Shopify conversion rate optimization can help—but your own store’s behavior data provides the foundation for any engagement.
Turn Shopify visitor behavior into higher conversions
Guesswork in optimization leads to wasted effort, while visibility into customer behavior leads to targeted, effective fixes. The most successful workflow is simple: see real customer journeys, identify friction that blocks revenue, fix what’s broken, and measure improvement.
MIDA gives Shopify merchants this visibility, combining session replay, heatmaps, funnel analytics, and surveys into one Shopify-native platform designed to turn behavior into conversions.
FAQs about improving Shopify conversion rates
What is a good ecommerce conversion rate for Shopify stores?
A “good” rate depends entirely on your industry, traffic sources, and product pricing—there’s no universal benchmark. The best approach is focusing on improving your own conversion rate over time rather than comparing to averages that may not reflect your situation.
How long does it take to see Shopify conversion rate improvements?
Quick fixes like simplifying checkout forms can show results within days. Larger changes like site redesigns may require weeks of data to evaluate properly. When A/B testing, always run tests long enough to reach statistical significance before declaring a winner.
What is the difference between store conversion rate and checkout conversion rate?
Store conversion rate measures the percentage of all sessions resulting in purchase (purchases ÷ all sessions). Checkout conversion rate is more specific—the percentage of sessions that reached checkout and then resulted in purchase (purchases ÷ sessions reaching checkout). The second metric helps isolate checkout friction from broader issues like traffic quality.

Hien Tran
I’m Hien Tran, a Product Marketing Executive at MIDA, specializing in eCommerce growth and conversion optimization. I focus on bridging product capabilities with real merchant needs—turning insights from heatmaps, session replays, and funnel analytics into actionable strategies that drive measurable results.


