Mobile Ecommerce Conversion Rates: 2026 Benchmarks and Industry Averages
Mobile devices drive the majority of ecommerce traffic, yet they convert at roughly half the rate of desktop. That gap represents both a problem and an opportunity—stores that close it capture revenue their competitors leave behind.
This guide covers current mobile conversion benchmarks by industry, explains why mobile underperforms, and walks through how to diagnose and fix the friction points that cost you sales.
What Is a Good Mobile Ecommerce Conversion Rate
Mobile ecommerce conversion rate measures the percentage of mobile visitors who complete a purchase. Most benchmark studies place the average between 1.5% and 3%, with 2% to 2.5% being typical for many stores. Desktop conversion rates, by comparison, tend to fall between 3% and 4.5%—roughly double mobile performance despite mobile accounting for the majority of ecommerce traffic.
What counts as “good” depends on your industry, traffic sources, and product type. A 2% mobile conversion rate might be strong for a furniture retailer but underwhelming for a food delivery brand. The mobile-desktop gap isn’t fixed, though. Stores that invest in mobile optimization often close it significantly.
If your mobile conversion sits below 1.5%, that’s worth investigating. The culprit is usually speed, checkout friction, or trust—problems that become visible once you watch how real visitors behave on your site.
>> You may also like: What is a Good Conversion Rate for Ecommerce Stores
Average Mobile Ecommerce Conversion Rate by Industry
Benchmarks vary widely across categories because purchase complexity, price points, and buyer intent differ. A $15 skincare product creates a very different mobile shopping experience than a $500 appliance.
| Industry | Typical Mobile Range | Key Influencing Factors |
|---|---|---|
| Retail and General Merchandise | 1.5%–2.5% | Product variety, impulse-friendly items |
| Fashion and Apparel | 1.2%–2.0% | Sizing uncertainty, return anxiety |
| Electronics and Home Appliances | 0.8%–1.5% | High price, research-heavy purchases |
| Food and Beverage | 2.5%–4.0% | Low consideration, repeat purchases |
| Health and Personal Care | 2.0%–3.0% | Privacy preference for personal devices |
| Home Decor and Furniture | 0.5%–1.5% | High AOV, visual evaluation needs |
| Pet Care and Supplies | 2.0%–3.5% | Subscription-friendly, repeat behavior |
Retail and General Merchandise
This broad category sees moderate mobile conversion, typically between 1.5% and 2.5%. Impulse-friendly products at lower price points perform better on mobile, while items requiring more consideration often see visitors switch to desktop before buying.
Fashion and Apparel
Sizing concerns create hesitation that drags mobile conversion down to 1.2% to 2.0%. Shoppers worry about fit and returns, which makes them more likely to browse on mobile but complete purchases elsewhere—or abandon entirely.
Electronics and Home Appliances
Higher price points and research-heavy purchases keep mobile conversion low, often between 0.8% and 1.5%. Buyers frequently use mobile for initial research, then switch to desktop to compare specs and complete the transaction.
Food and Beverage
Consumables with repeat purchase behavior convert higher on mobile, typically 2.5% to 4.0%. The lower consideration threshold and product familiarity reduce friction. Subscription models and quick reorder flows amplify this advantage.
Health and Personal Care
Privacy-sensitive purchases often see stronger mobile conversion, ranging from 2.0% to 3.0%. Shoppers prefer personal devices for these categories, and products tend to be lower-priced with established brand trust.
Home Decor and Furniture
This visual-heavy, high-AOV category struggles on mobile, with conversion rates often between 0.5% and 1.5%. Shoppers use mobile for discovery and inspiration but typically move to desktop—or visit physical stores—before committing.
Pet Care and Supplies
Repeat purchases and subscription-friendly products support stronger mobile conversion, usually 2.0% to 3.5%. Pet owners often reorder the same items regularly, reducing the decision-making friction that hurts other categories.
Mobile vs Desktop Conversion Rates
The mobile-desktop gap is one of the most consistent patterns in ecommerce analytics. Despite mobile commanding 60% to 70% of traffic for most stores, it converts at roughly half the rate of desktop.
Why Mobile Converts Lower Than Desktop
Several factors contribute to this persistent gap:
- Smaller screens: Evaluating products and navigating checkout becomes harder when you can’t see as much at once.
- Distracted browsing: Mobile sessions tend to be shorter and more interruptible—people shop while commuting, waiting in line, or watching TV.
- Checkout friction: Typing payment information and shipping addresses on a phone keyboard is tedious, even with autofill.
- Trust concerns: Shoppers sometimes feel less secure completing high-value purchases on mobile devices.
How Much Lower Mobile Typically Converts
In most categories, mobile conversion runs about 40% to 60% of desktop rates. If your desktop converts at 4%, expect mobile closer to 2%.
However, this gap represents opportunity rather than inevitability. Stores that optimize mobile UX—faster load times, simplified checkout, better trust signals—often see their mobile rates climb toward desktop levels.
Mobile Conversion Rate by Traffic Channel
Different traffic sources bring visitors with different intent levels, which shows up clearly in conversion rates.
| Channel | Relative Mobile Conversion | Why |
|---|---|---|
| Highest | Subscribers already know and trust your brand | |
| Organic Search | Moderate | Visitors have intent but are comparing options |
| Paid Search | Variable | Branded terms convert higher than generic |
| Social Media | Lowest | Traffic is often top-of-funnel, discovery-oriented |
Email Traffic
Email consistently delivers the highest mobile conversion rates because subscribers have already opted in. They know your brand, trust your products, and often click through with purchase intent already formed.
Organic Search Traffic
Organic visitors have demonstrated intent by searching for something related to your products. However, they’re often still in comparison mode, which keeps conversion moderate. The quality of your landing page experience matters enormously here.
Paid Search Traffic
Conversion varies significantly by keyword intent. Branded search terms—people searching for your store by name—convert much higher than generic category terms. A visitor searching “Nike running shoes” behaves differently than one searching “best running shoes.”
Social Media Traffic
Social traffic typically converts lowest because it’s often discovery-oriented. Someone scrolling Instagram might tap on an interesting ad without any purchase intent. This traffic can still build awareness, but expecting high immediate conversion sets unrealistic expectations.
How to Calculate Mobile Ecommerce Conversion Rate
The formula is straightforward: (Mobile Orders ÷ Mobile Sessions) × 100.
If your store had 10,000 mobile sessions last month and 200 mobile orders, your mobile conversion rate is 2.0%. Note that sessions and unique visitors aren’t the same—one person might visit three times before purchasing, creating three sessions but one unique visitor. Most conversion rate calculations use sessions as the denominator.
You can find device-segmented data in Shopify’s Analytics section under “Sessions by device type” or in Google Analytics by applying a device category filter to your conversion reports.
Mobile Conversion Metrics Beyond the Basics
Conversion rate alone doesn’t tell the full story. Several supporting metrics reveal where mobile shoppers drop off and why.
Mobile Add-to-Cart Rate
Add-to-cart rate measures the percentage of mobile sessions where a visitor adds at least one product to their cart. A healthy add-to-cart rate paired with low checkout completion signals friction after interest is established—something is going wrong between “I want this” and “I bought this.”
Mobile Cart Abandonment Rate
Cart abandonment measures how many carts never proceed to checkout. Mobile cart abandonment rates often exceed 80%, significantly higher than desktop. Common culprits include unexpected shipping costs, account creation requirements, and slow page loads.
Mobile Checkout Completion Rate
Checkout completion tracks the percentage of started checkouts that result in completed orders. Low completion rates point to checkout-specific friction: form complexity, payment issues, or trust concerns at the final step.
Mobile Average Order Value
AOV measures the average revenue per mobile order. Lower mobile AOV compared to desktop might indicate that shoppers save larger purchases for bigger screens, or that your mobile experience doesn’t effectively encourage add-ons.
Mobile Traffic Share
Traffic share is simply the percentage of your total sessions coming from mobile devices. If mobile accounts for 70% of your traffic but only 40% of your revenue, mobile optimization becomes urgent—you’re leaving significant money on the table.
How to Improve Your Mobile Ecommerce Conversion Rate
Improving mobile conversion typically involves reducing friction at key moments in the shopping journey.
1. Optimize Mobile Page Speed
Slow pages cause abandonment before shoppers even see your products. Compressing images, reducing third-party scripts, and leveraging Shopify’s built-in performance optimizations all help. Every additional second of load time correlates with measurable conversion drops.
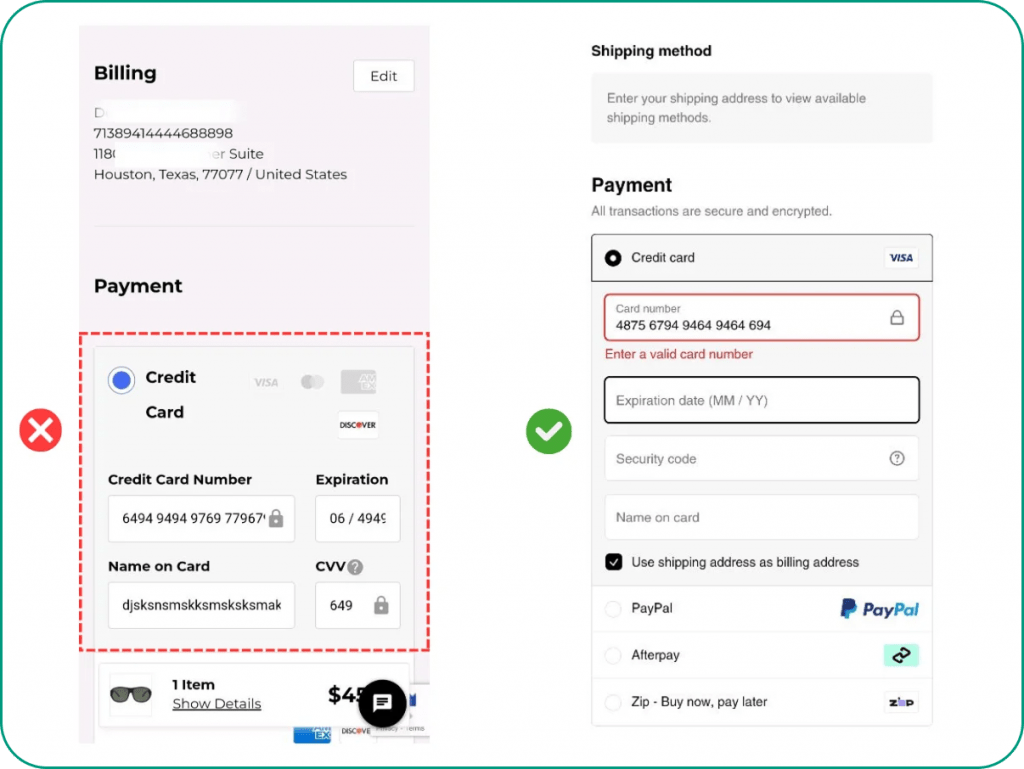
2. Simplify Mobile Checkout Flow
Reducing form fields to the essentials, enabling autofill wherever possible, and offering express payment options like Shop Pay and Apple Pay removes barriers. Every extra step in checkout loses buyers—mobile shoppers have even less patience than desktop visitors.
>> Explore: How To Optimize Shopify Checkout Using Behavior Analytics
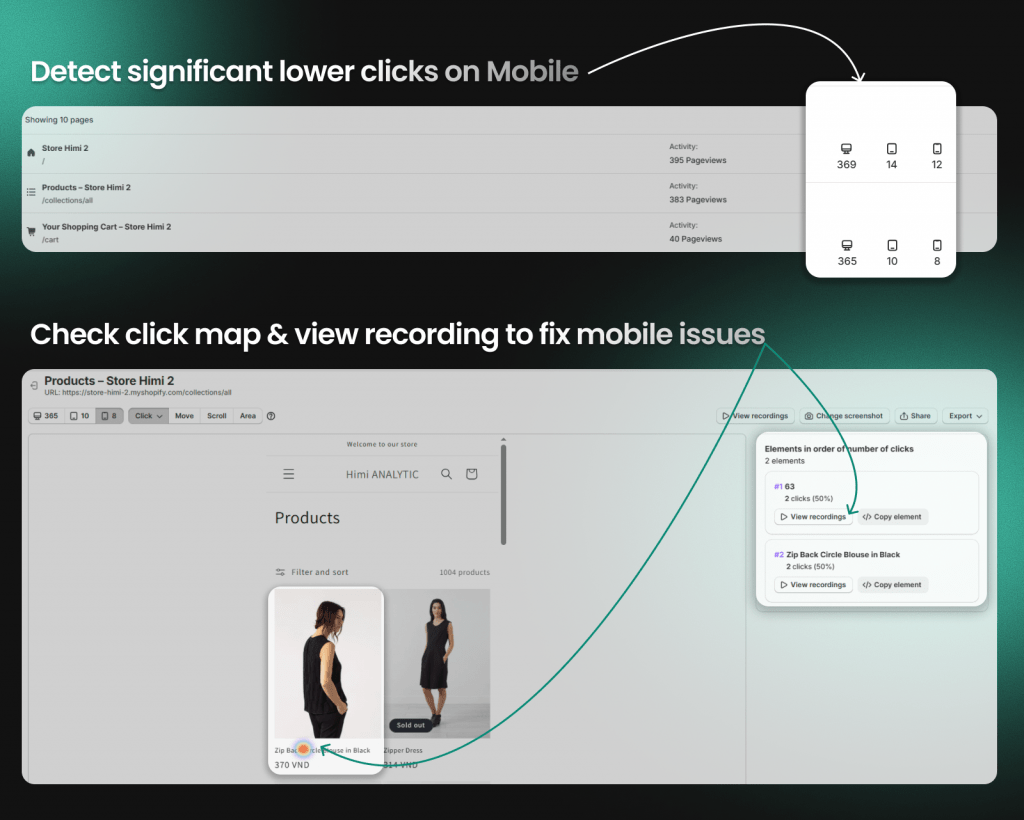
3. Fix Mobile UX Friction Points
Rage clicks (repeated frustrated clicking on elements that don’t respond), dead clicks (taps on non-interactive elements), and hesitation patterns all signal problems. Behavior analytics tools like session replay and heatmaps reveal exactly where mobile users struggle, turning vague “something’s wrong” into “here’s the exact moment it happened.”
4. Add Mobile-Specific Trust Signals
Displaying security badges, customer reviews, and return policies prominently on mobile helps address buyer hesitation. Smaller screens mean shoppers see less context at once, so trust signals visible on desktop might be hidden below the fold on mobile.
5. Test Mobile Layouts and CTAs
Running A/B tests on button placement, sticky add-to-cart bars, and product image layouts reveals what works for your specific audience. What performs well on desktop often fails on mobile—thumb-friendly tap targets and visible CTAs matter more on smaller screens.
How to Diagnose Mobile Conversion Friction
Aggregate metrics tell you a problem exists. Behavior analytics show you why.
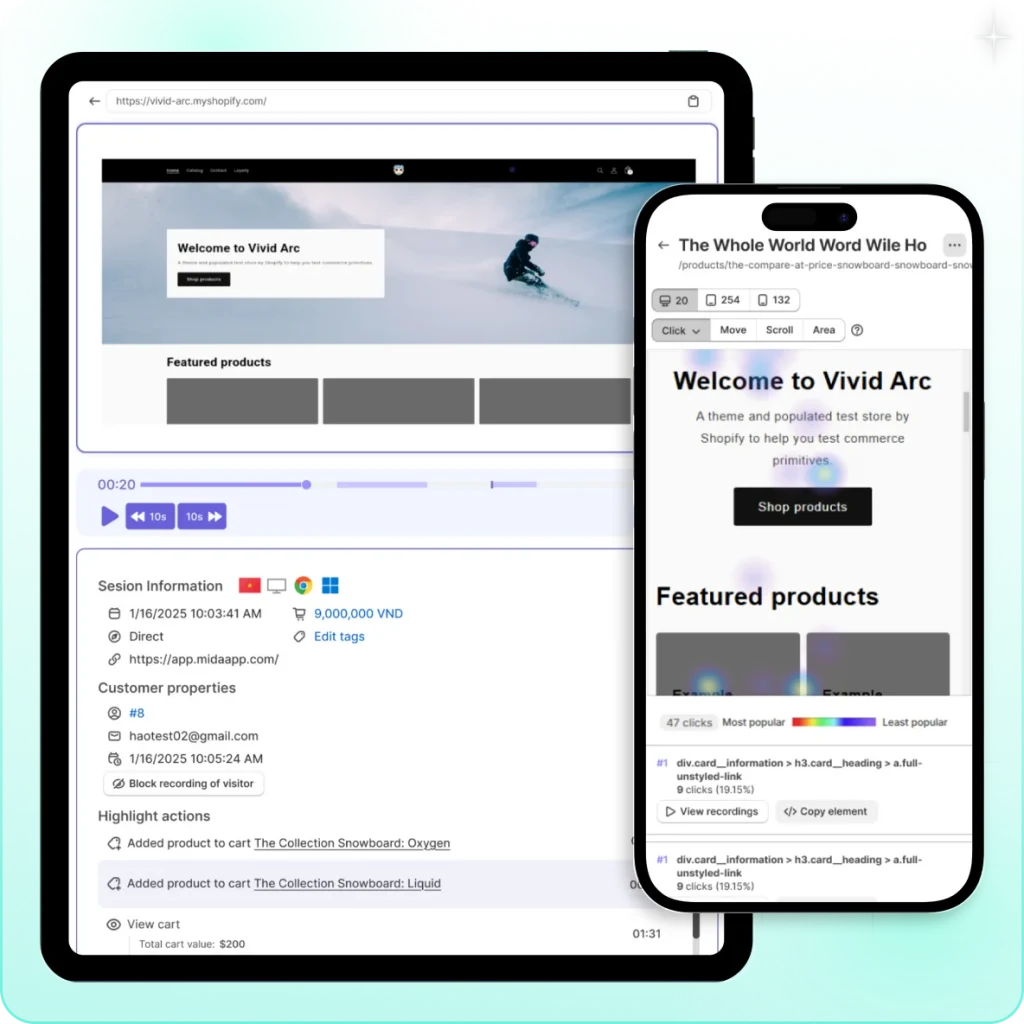
Session replay lets you watch real mobile visitor journeys—where they hesitate, backtrack, or abandon. Instead of guessing why checkout completion dropped, you can watch the exact sessions where it happened.
Heatmaps show which mobile page elements get attention and which are ignored, revealing whether your CTA is actually visible or buried below the scroll. Funnel analysis identifies the exact step where mobile drop-off spikes. If 60% of mobile visitors who add to cart never start checkout, that’s a different problem than 60% who start checkout but don’t complete it.
Shopify-native tools like MIDA connect behavior directly to orders, abandoned carts, and customer profiles. You can click from a funnel drop-off straight into the session replays where that abandonment happened—then prioritize fixes based on revenue impact rather than guesswork.
Tools for Monitoring Mobile Ecommerce Conversion
Native Shopify Analytics
Shopify’s built-in analytics are free and show device breakdown with basic conversion data. They’re useful for tracking trends but limited in depth—you can see that mobile conversion dropped, but not why visitors left.
Google Analytics
GA4 lets you segment by device and channel with more granularity. It requires setup and interpretation skill to use effectively for ecommerce, and it doesn’t natively understand Shopify’s data structure without proper configuration.
Behavior Analytics and Session Replay Tools
Tools like MIDA, Hotjar, and Lucky Orange show actual visitor behavior through session recordings and heatmaps. MIDA is built specifically for Shopify, linking sessions directly to orders, carts, and customer profiles for ecommerce-specific insights. This bridges the gap between “conversion dropped” and actionable diagnosis.
Try MIDA for free to see how connecting behavior to revenue changes the way you optimize.
From Mobile Benchmarks to Revenue Improvements
Benchmarks tell you where you stand relative to industry averages. They don’t tell you what to fix.
The stores that consistently improve mobile conversion aren’t the ones obsessing over whether 2.1% is “good enough.” They’re the ones watching real mobile sessions, identifying specific friction points, and prioritizing fixes based on revenue impact. A checkout form that confuses 30% of mobile visitors is worth more attention than a product page that underperforms by 0.2%.
The gap between your current mobile conversion rate and what’s possible often comes down to a handful of fixable friction points—you just have to see them first.
FAQs About Mobile Ecommerce Conversion Rates
Does mobile ecommerce conversion rate change during holiday seasons?
Yes, mobile conversion typically increases during peak shopping periods like Black Friday and the December holidays. Urgency, promotions, and gift-buying intent reduce the hesitation that normally drags mobile conversion down. Many stores see their highest mobile conversion rates in November and December.
What is a good conversion rate for mobile landing pages?
Mobile landing page conversion depends heavily on traffic source and page intent. Campaign-specific landing pages with focused messaging often convert higher than general product pages. A well-optimized mobile landing page for a specific promotion might convert at 3% to 5%, while a general collection page might sit closer to 1% to 2%.
How does Shopify mobile conversion compare to other ecommerce platforms?
Shopify stores typically perform in line with industry averages for their respective categories. Platform differences matter less than store-specific factors like page speed, checkout optimization, and mobile UX quality. A well-optimized Shopify store can outperform a poorly optimized store on any platform.
What mobile conversion rate can stores expect from paid advertising?
Paid traffic mobile conversion varies widely based on ad quality, targeting precision, and landing page relevance. Branded campaigns—where people already know your store—convert significantly higher than prospecting campaigns targeting cold audiences. Prospecting traffic often converts 30% to 50% lower than organic mobile traffic.
How frequently is it helpful to monitor mobile conversion rate?
Weekly monitoring catches trends early without creating noise from daily fluctuations. Reviewing mobile conversion after any site change, campaign launch, or significant traffic shift helps identify whether changes are helping or hurting. If you notice a sudden drop, behavior analytics can help you identify whether it’s a traffic quality issue or a site experience problem.

Hien Tran
I’m Hien Tran, a Product Marketing Executive at MIDA, specializing in eCommerce growth and conversion optimization. I focus on bridging product capabilities with real merchant needs—turning insights from heatmaps, session replays, and funnel analytics into actionable strategies that drive measurable results.


