The Complete Guide to Eye Tracking Heatmap Tools
An eye tracking heatmap is a color-coded visualization showing where people look on a screen, with red indicating high attention and blue showing areas visitors ignore. Unlike standard analytics that tell you visitors left your page, eye tracking heatmaps reveal why—perhaps they never noticed your call-to-action in the first place.
This guide covers how eye tracking heatmaps work, compares them to click and scroll heatmaps, and walks through the best tools for different use cases—from AI-powered predictive analysis to behavior-based platforms built for live website optimization.
>> You may also like:
- Heatmap Analysis: 10 Best Practices for Better Insights
- What Is a Heatmap? Definition, Types, and Use Cases
What is an eye tracking heatmap
An eye tracking heatmap is a color-coded visualization showing where people look on a screen, webpage, or image. Red and orange areas mark where eyes linger longest, while blue and green zones indicate sections that receive little attention. Areas with no color are essentially invisible to viewers.
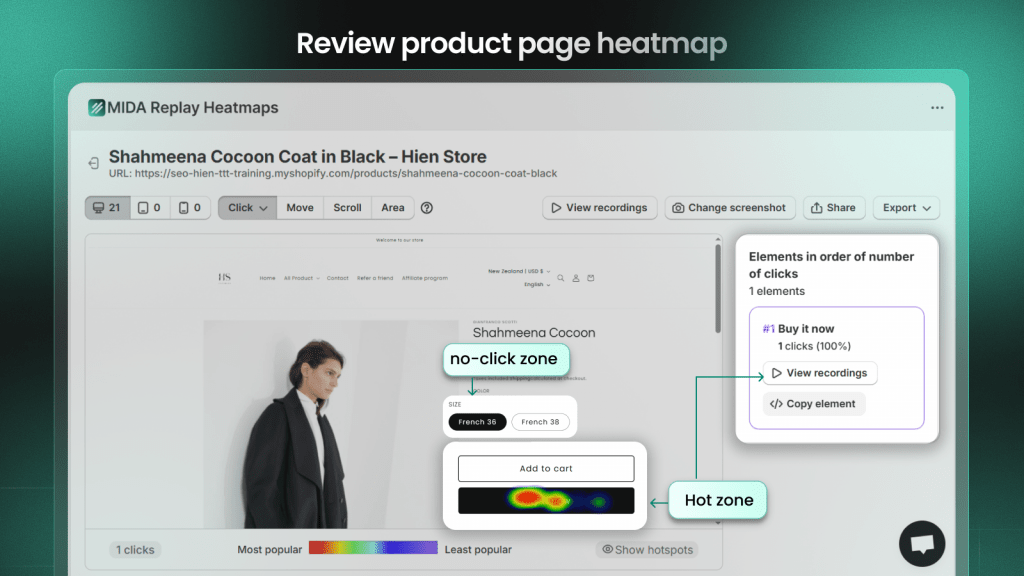
Think of it like a thermal camera for attention. Your analytics might tell you that 500 people visited your product page, but an eye tracking heatmap reveals that most of them never actually looked at your “Add to Cart” button—a large product image dominated their attention instead.
- Hot zones: Areas where eyes spend the most time, typically shown in red or orange
- Cold zones: Sections visitors skip or barely notice, displayed in blue or green
- Gaze path: The sequence showing how attention moves across the page
How eye tracking heatmaps work
Eye tracking heatmaps rely on two fundamentally different approaches to capture where people look.
Hardware-based tracking uses specialized cameras that follow pupil movement. Infrared light tracks the eye’s position with high precision. You’ll find this approach in academic research labs and professional UX testing facilities where participants sit in front of calibrated equipment.
Predictive AI models take a different approach. Trained on thousands of eye tracking studies, these algorithms analyze visual elements like contrast, faces, text, and layout to estimate where attention will naturally flow. You upload a screenshot or URL, and the software generates a predicted attention map—no hardware required.
Most website optimization tools take a third approach: tracking behavioral proxies like mouse movement, clicks, and scroll depth. Research shows that cursor position often correlates with gaze direction, especially on desktop. While not true eye tracking, behavior-based heatmaps provide actionable data from real visitors at scale.
Eye tracking heatmaps vs click and scroll heatmaps
Each heatmap type measures something distinct about visitor behavior. Here’s how they compare:
| Heatmap Type | What It Measures | Best For |
| Eye tracking heatmap | Where visitors look | Pre-launch design validation |
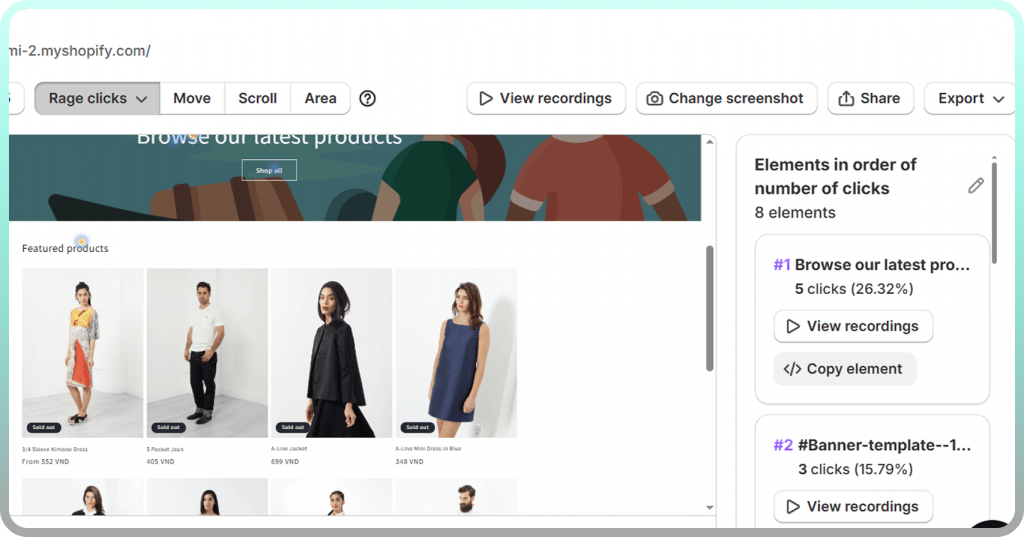
| Click heatmap | Where visitors click or tap | Finding dead clicks, rage clicks, ignored CTAs |
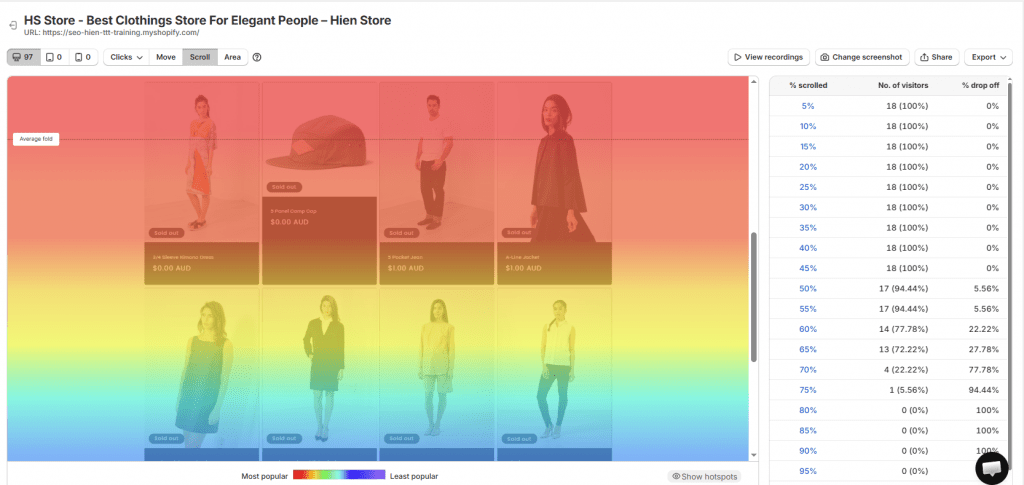
| Scroll heatmap | How far visitors scroll | Identifying content drop-off points |
| Mouse movement heatmap | Cursor paths on desktop | Approximating attention patterns |
Eye tracking heatmaps
Eye tracking captures visual attention regardless of whether someone interacts with an element. A visitor might stare at your hero image for five seconds without clicking anything—eye tracking reveals this, while click maps would show nothing.
Click heatmaps
Click maps show actual interactions. They reveal whether attention converts to action, exposing problems like buttons that look clickable but aren’t, or rage clicks where frustrated visitors tap repeatedly on unresponsive elements.
Scroll heatmaps
Scroll depth visualization displays what percentage of visitors reach each section of your page. If only 30% of visitors scroll far enough to see your product reviews, you’re hiding social proof from 70% of potential customers.
Mouse movement heatmaps
Mouse movement heatmaps track cursor position as a proxy for gaze on desktop devices. The correlation between mouse position and eye position is reasonably strong when people are actively reading, though less reliable when visitors move their cursor randomly while thinking.
Why eye tracking heatmaps matter for conversion optimization
Eye tracking heatmaps connect visual attention directly to revenue outcomes by revealing why visitors don’t convert—not just that they didn’t.
Consider a common scenario: your product page gets plenty of traffic but has a low add-to-cart rate. Analytics shows the problem exists, but an eye tracking heatmap might reveal that visitors focus entirely on the product image gallery and never scroll down to see the “Buy Now” button. The fix becomes obvious once you see the attention pattern.
- Validate design decisions: See whether your headline or hero image actually captures attention as intended
- Find invisible elements: Discover important CTAs, trust badges, or value propositions that shoppers completely overlook
- Prioritize fixes: Know which page sections require repositioning versus which require a complete redesign
Types of eye tracking heatmap tools
Before evaluating specific tools, it helps to understand the three main categories available. Each serves different use cases and budgets.
Hardware-based eye tracking systems
Hardware systems require physical equipment—typically infrared cameras mounted below or around a screen. Participants sit in controlled environments while the hardware tracks their pupil position with millimeter precision.
The accuracy is exceptional. However, the cost runs from several thousand to tens of thousands of dollars, and you’re limited to testing with recruited participants rather than real website visitors. Tools like Tobii and GazePoint fall into this category.
AI-powered predictive attention tools
Predictive tools use machine learning models trained on extensive eye tracking research to estimate where people will look on any design. You upload a mockup, screenshot, or URL, and the algorithm generates an attention heatmap within seconds.
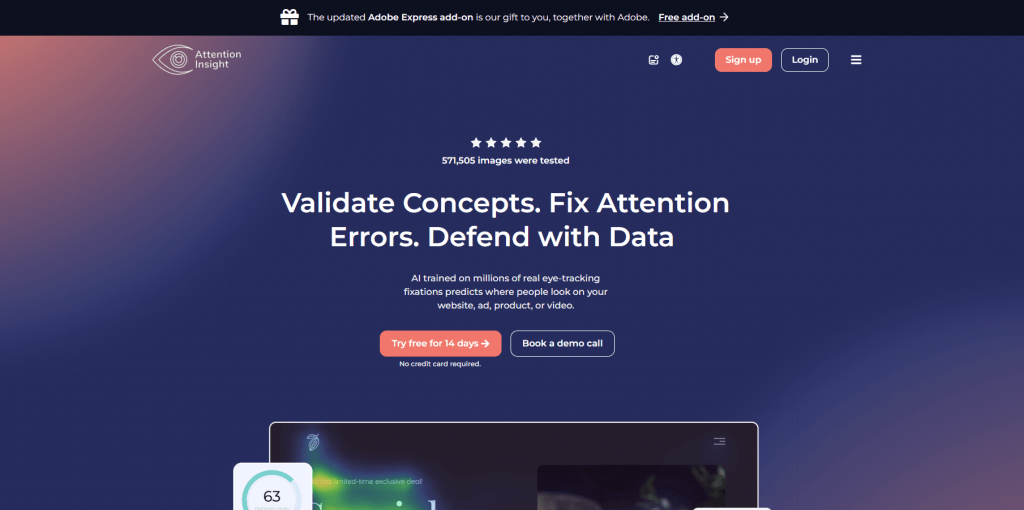
These tools excel at pre-launch validation—testing designs before they go live. Attention Insight and UserInput.io are examples. The tradeoff is that predictions, while often accurate, don’t capture the actual behavior of your specific audience.
Behavior-based heatmap platforms
Behavior-based platforms track real visitor actions on live websites: clicks, scrolls, mouse movements, and touch gestures. While not technically eye tracking, they provide behavioral data at scale from your actual customers.
For Shopify merchants optimizing live stores, behavior-based tools typically deliver more actionable insights than lab-based eye tracking. You see what real shoppers do, filtered by segments like device type, traffic source, or purchase outcome. Mida, Hotjar, and Lucky Orange fall into this category.
Best website eye tracking heatmap tools
The right tool depends on whether you want predictive attention analysis before launch or behavioral data from real visitors.
Mida
Mida is a Shopify-native behavior analytics platform combining click, scroll, and movement heatmaps with session recordings and on-site surveys. Unlike general-purpose tools, Mida connects behavioral signals directly to Shopify data—orders, cart values, and checkout events.
The platform lets you filter heatmaps by visitors who purchased versus those who abandoned, revealing what converting customers actually engage with. You can jump directly from a heatmap hotspot into the session recordings where that element was clicked.
Best for: Shopify merchants who want behavior data connected to revenue outcomes.
Attention Insight
Attention Insight uses AI trained on eye tracking studies to predict where visitors will look on any design. Upload a mockup or screenshot, and you’ll receive a predicted attention heatmap showing likely focus areas without needing live traffic.
Best for: Designers validating layouts before development.
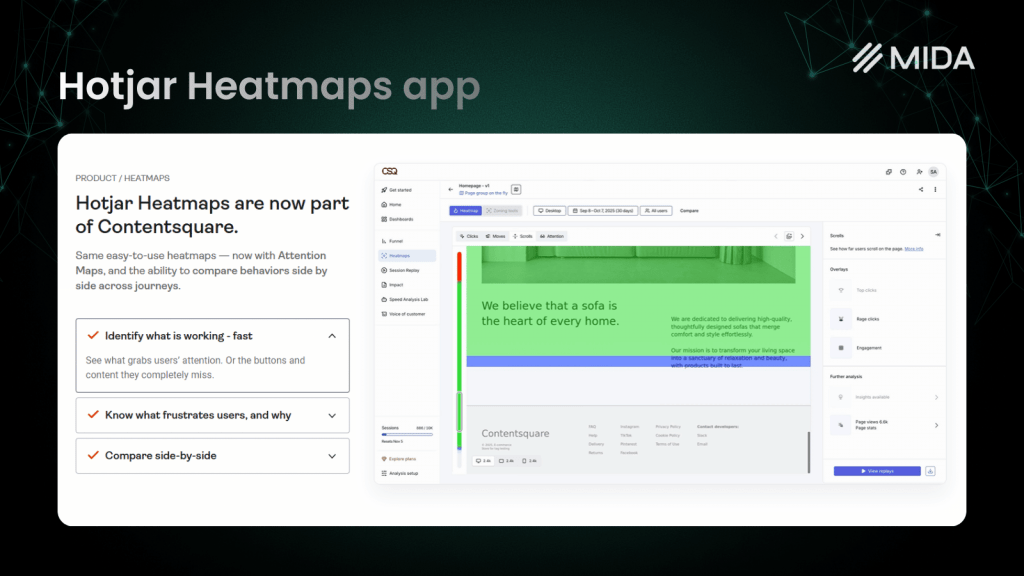
Hotjar
Hotjar offers click and scroll heatmaps alongside session recordings and feedback tools. It’s one of the most recognized names in website analytics, with extensive documentation and a large user community.
Best for: Teams already familiar with Hotjar from other projects.
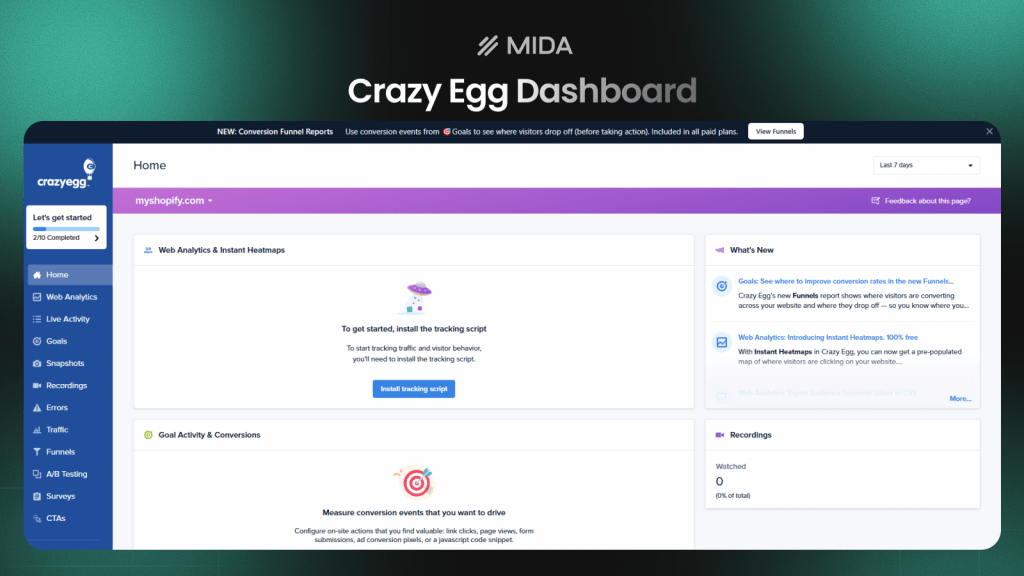
Crazy Egg
Crazy Egg pioneered commercial heatmap tools and maintains a reputation for simplicity. The “Snapshots” feature creates comprehensive heatmap reports for any page, while scrollmaps show exact drop-off percentages at every pixel depth.
Best for: Merchants wanting straightforward heatmap analysis without complexity.
VWO
VWO provides heatmaps as part of a full conversion rate optimization suite that includes A/B testing, personalization, and analytics. The platform is enterprise-focused with corresponding complexity and pricing.
Best for: Larger organizations running comprehensive CRO programs.
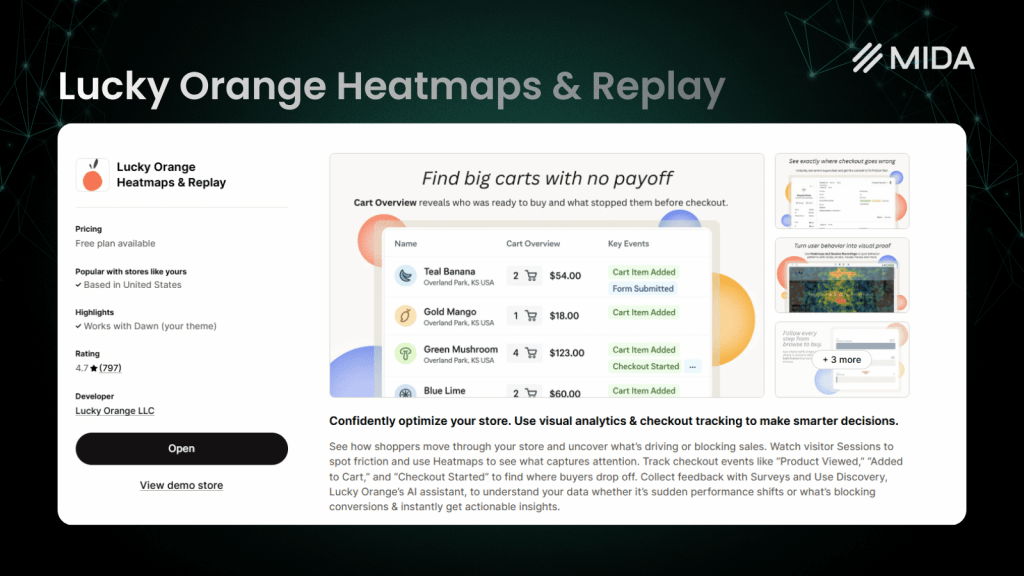
Lucky Orange
Lucky Orange combines real-time visitor tracking with dynamic heatmaps that update as customers browse. The platform includes built-in live chat for engaging with visitors who show signs of confusion.
Best for: Stores wanting to monitor behavior in real-time.
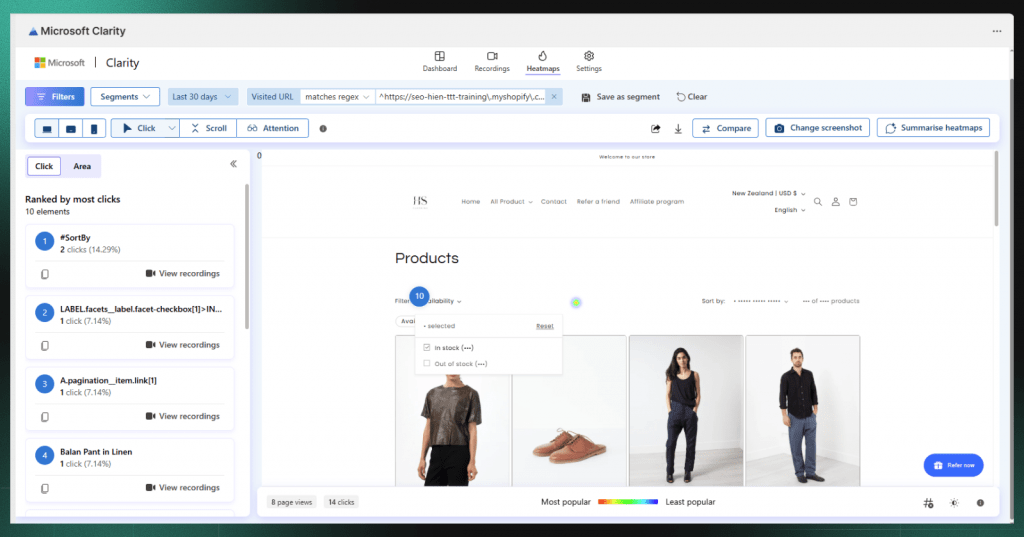
Microsoft Clarity
Clarity is a free tool from Microsoft offering heatmaps and session recordings with no traffic limits. It lacks ecommerce-specific features but provides solid basic functionality at no cost.
Best for: Budget-conscious merchants who don’t require Shopify-specific integrations.
How to read and interpret eye tracking heatmaps
Collecting heatmap data is only valuable if you know how to extract insights from the visualizations.
Understanding heatmap color scales
Red and orange indicate high attention or activity, while green and blue show low engagement. Areas with no color overlay are essentially invisible to visitors.
One important nuance: most heatmap tools use relative scales. The hottest spot on your page will always appear red, even if overall engagement is low. Compare patterns across pages rather than assuming red always means “good.”
Identifying attention hotspots
Look for red clusters and ask whether they appear on elements that matter. Hotspots on your CTA button or key product information suggest good design alignment. Hotspots on decorative images or secondary navigation might indicate attention is being pulled away from conversion-critical elements.
Spotting ignored areas
Blue zones and colorless areas reveal what visitors skip. If your value proposition, trust badges, or shipping information sits in cold zones, visitors aren’t seeing the content you assume they’re reading.
Common visitor behavior patterns revealed by heatmaps
Decades of eye tracking research have identified predictable patterns in how people scan pages.
The F-pattern
On text-heavy pages, visitors often scan horizontally across the top, move down the left side, then make a second horizontal scan partway down. The result looks like the letter F. Content in the top-left quadrant gets the most attention, while the right side and bottom often get skipped.
The Z-pattern
On pages with minimal text and strong visual hierarchy—like landing pages—eyes tend to move from top-left to top-right, then diagonally to bottom-left, and finally across to bottom-right.
Banner blindness
Visitors automatically ignore anything that looks like an advertisement, including promotional banners you actually want them to see. Heatmaps reveal banner blindness clearly: you’ll see cold zones exactly where banner-style elements appear.
Scroll drop-off
Scroll heatmaps show the exact point where visitors stop scrolling. Most pages see significant drop-off after the first screenful of content. If your CTA sits below where 70% of visitors stop scrolling, most potential customers never see it.
How to use eye tracking heatmap data to improve your store
Heatmap insights only create value when you act on them.
1. Identify high-attention areas
Start by finding what naturally draws the eye on your key pages. If your “Add to Cart” button sits outside the main attention zone while a decorative image dominates visitor focus, you’ve found an optimization opportunity.
2. Find overlooked elements
Locate important content sitting in cold zones. Your shipping policy, return guarantee, or product benefits might be invisible to most visitors simply because of where they’re positioned.
3. Test layout changes
Use heatmap insights to form hypotheses, then validate with A/B testing. For example, if your heatmap shows visitors ignore a CTA in the sidebar, test moving it into the main content area where attention concentrates.
4. Connect insights to revenue
Behavior-based tools like Mida let you filter heatmaps by visitor outcomes—comparing what purchasers engaged with versus what cart abandoners ignored. This connection between attention and revenue transforms heatmaps from interesting visualizations into profit-driving insights.
Choosing the right eye tracking heatmap tool
The best tool depends on your specific situation.
For pre-launch design validation
If you want to test mockups before development, AI-powered predictive tools like Attention Insight provide fast feedback without needing live traffic.
For live website optimization
If you’re analyzing real visitor behavior on your current site, behavior-based heatmap tools deliver actionable data at scale. Look for platforms offering click maps, scroll maps, and session replays.
For Shopify and ecommerce stores
Ecommerce optimization requires connecting behavior to business outcomes. Choose a tool built for your platform—one that integrates with Shopify data, tracks checkout events, and lets you filter by purchase behavior. Mida is purpose-built for this use case.
Turn heatmap insights into higher conversions
Heatmaps transform optimization from guesswork into evidence-based decision making. Instead of debating where to place your CTA or whether visitors notice your trust badges, you see exactly where attention goes—and where it doesn’t.
The most valuable approach combines heatmaps with session recordings and customer feedback. Seeing where visitors click matters less if you don’t understand why they clicked there or what they expected to happen.
FAQs about eye tracking heatmaps
What is the most accurate eye tracking system?
Hardware-based eye trackers using infrared cameras provide the highest accuracy for research purposes. However, for website optimization, behavior-based heatmaps tracking real clicks and scrolls often deliver more actionable data because they capture actual visitor behavior at scale.
Can ChatGPT create heatmaps?
ChatGPT cannot generate heatmaps because it doesn’t have access to your website’s visitor behavior data or the ability to analyze visual designs. Creating heatmaps requires either specialized eye tracking hardware, AI models trained specifically on attention research, or tracking scripts installed on your live website.
How much does eye tracking software cost?
Pricing varies dramatically by category. Hardware-based systems run from several thousand to tens of thousands of dollars. AI-powered predictive tools typically charge $20-200 per month depending on usage. Behavior-based heatmap platforms range from free tiers with limited sessions to enterprise plans at several hundred dollars monthly.
Do eye tracking heatmaps require special hardware?
Traditional eye tracking requires cameras and controlled environments, but modern website heatmap tools work entirely through software. Predictive AI tools analyze uploaded images, while behavior-based platforms use JavaScript installed on your site—no hardware required for either approach.
How are eye tracking heatmaps different from session recordings?
Heatmaps aggregate behavior across many visitors into a single visualization showing overall attention patterns. Session recordings let you watch individual visitor journeys to understand the context behind specific actions. Heatmaps reveal what’s happening at scale, while recordings explain why it’s happening.


