Free Ecommerce Conversion Rate Calculator
Your store gets traffic, but you’re not sure how much of it actually converts into sales. Without a clear conversion rate, you’re optimizing blind—making changes without knowing whether they help or hurt.
This guide gives you a free calculator to measure your ecommerce conversion rate, breaks down the formula behind it, and shows you how to interpret the results by funnel step, traffic source, and device.
Ecommerce conversion rate calculator
Enter your visitor count and number of orders to instantly calculate your store’s conversion rate.
What is ecommerce conversion rate
Ecommerce conversion rate is the percentage of visitors who complete a purchase. If your store were a physical shop, this metric tells you how many people who walked through the door actually left with a bag.
The number reveals how effectively your store turns browsers into buyers. A low rate typically points to friction somewhere in the experience—maybe confusing navigation, unclear product details, or a checkout flow that loses people before they finish.
Ecommerce conversion rate formula
Basic conversion rate formula
The formula is simple:
(Number of Orders ÷ Total Visitors) × 100 = Conversion Rate %
So if your store had 5,000 visitors last month and 150 orders, your conversion rate would be (150 ÷ 5,000) × 100 = 3%. This gives you a baseline to compare against your own past performance and general industry patterns.
Advanced conversion rate formula
The basic formula works for overall performance, though you can get more specific. Some merchants use unique visitors instead of total sessions, which avoids counting the same person multiple times during a period.
You might also calculate separate rates by traffic source. Breaking out organic search, paid ads, email, and social traffic shows which channels bring purchase-ready shoppers versus casual browsers.
How to calculate your ecommerce conversion rate
1. Gather your visitor and order data
Pull your visitor count and order total from Shopify Analytics or your preferred tool. Make sure both numbers cover the same date range—comparing a month of visitors to a week of orders won’t give you anything useful.
2. Apply the conversion rate formula
Divide total orders by total visitors, then multiply by 100. The calculator above handles this automatically, though the math is straightforward enough to do on your own when you want a quick check.
3. Interpret your conversion rate results
A higher rate means more visitors are buying. A lower rate suggests something is blocking purchases—but the number alone won’t tell you what that something is.
If your rate seems low, the next step is figuring out where shoppers drop off. Are they leaving product pages without adding to cart? Starting checkout but not finishing? Each scenario points to different problems worth investigating.
How to calculate conversion rate by funnel step
Overall conversion rate is useful as a headline number, but it hides where exactly you’re losing shoppers. Breaking down conversion by funnel step pinpoints the specific moment people leave.
Product page to cart conversion rate
(Add to Carts ÷ Product Page Views) × 100
This rate shows whether your product pages convince visitors to take action. Low numbers here often point to issues with product images, descriptions, pricing clarity, or missing reviews—anything that leaves shoppers uncertain about what they’re getting.
Cart to checkout conversion rate
(Checkouts Started ÷ Carts Created) × 100
Drops at this stage typically signal unexpected costs like shipping or taxes, confusing cart layouts, or missing trust signals. Shoppers have already shown intent by adding items, so something changed their mind between cart and checkout.
Checkout to purchase conversion rate
(Completed Orders ÷ Checkouts Started) × 100
Friction in checkout—form errors, slow loading, limited payment options, forced account creation—causes abandoned checkouts. This is often the most expensive place to lose a customer since they were moments away from completing the purchase.
What is a good ecommerce conversion rate
There’s no universal “good” number. A 2% rate might be excellent for one store and concerning for another, depending on industry, traffic quality, and price point.
Benchmarks by industry
| Industry | Typical Conversion Rate Range |
|---|---|
| Fashion & Apparel | 1.5% – 2.5% |
| Health & Beauty | 2.5% – 3.5% |
| Electronics | 1.0% – 2.0% |
| Home & Garden | 2.0% – 3.0% |
| Food & Beverage | 3.0% – 5.0% |
These ranges serve as general reference points rather than targets. Your own historical data matters more than industry averages when measuring progress.
Benchmarks by traffic source
Traffic quality affects conversion dramatically—not all visitors arrive with the same purchase intent.
- Email traffic: Warmer audience who already knows your brand, typically converts highest
- Direct traffic: Returning visitors with existing familiarity
- Organic search: Intent varies by keyword—”buy [product]” converts better than “[product] reviews”
- Paid ads: Depends heavily on targeting quality and how well the ad matches the landing page
- Social media: Often lower intent, more browsing behavior
Benchmarks by device
Desktop typically converts higher than mobile—often 1.5x to 2x higher. The gap usually comes down to checkout experience: smaller screens, harder form entry, and more distractions make completing a purchase on mobile more difficult.
Tracking your own desktop versus mobile rates reveals whether your mobile experience deserves attention.
>> Explore: 2026 Ecommerce Conversion Funnel Benchmarks and Statistics
Factors that affect your site conversion rate
Knowing your conversion rate is only useful if you understand what influences it.
Website speed and page load time
Slow pages cause visitors to leave before seeing your products. Each additional second of load time increases bounce rates and reduces the likelihood of purchase.
User experience and navigation
UX refers to how easy and pleasant your store is to use. Confusing menus, hard-to-find products, and cluttered layouts frustrate shoppers. If visitors can’t quickly find what they want, they leave.
Product page quality
Images, descriptions, pricing clarity, and reviews all influence whether someone adds to cart. Shoppers who can’t find the information they want—sizing details, materials, shipping times—often abandon rather than guess.
Checkout friction
Checkout friction is anything that slows or confuses the purchase process: too many form fields, forced account creation, unclear shipping costs revealed late, or limited payment methods.
Trust signals and social proof
Customer reviews, security badges, clear return policies, and recognizable payment icons reassure shoppers your store is legitimate. Missing trust signals make visitors hesitant to enter payment information.
Traffic quality and source
Not all visitors have equal purchase intent. Poorly targeted ads bring window shoppers who inflate visitor counts without buying. Relevant organic traffic from high-intent searches brings motivated buyers.
Benefits of using a free conversion rate calculator
- Instant baseline measurement: Know where you stand before making any changes
- Track improvement over time: Compare rates week over week or month over month to spot trends
- Identify underperforming segments: Calculate separately by traffic source or device to find weak spots
- Prioritize optimization efforts: Focus resources where conversion rate is lowest relative to traffic volume
- Measure campaign effectiveness: See how promotions or site changes impact your rate
How to improve your web conversion rate
Calculating your rate is the starting point. Improving it requires understanding why visitors don’t convert—and that means moving beyond numbers to actual behavior.
1. Identify where shoppers drop off
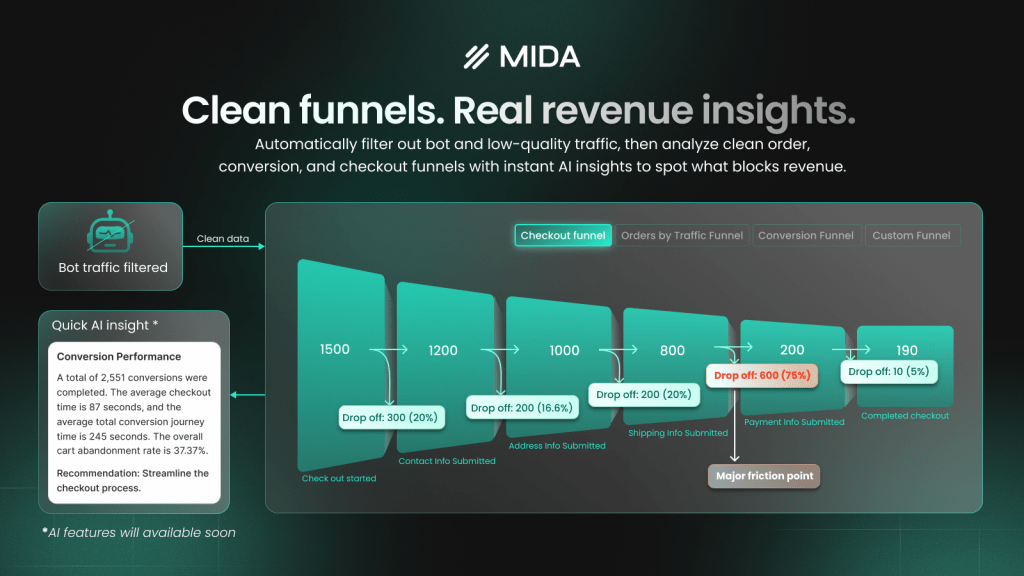
Use funnel analysis to find the step with the biggest drop. Is it product page to cart? Cart to checkout? Checkout to purchase? Each location suggests different problems.
MIDA’s order funnel visualization shows exactly which step loses the most shoppers, so you know where to focus first.
2. Watch real sessions to find friction
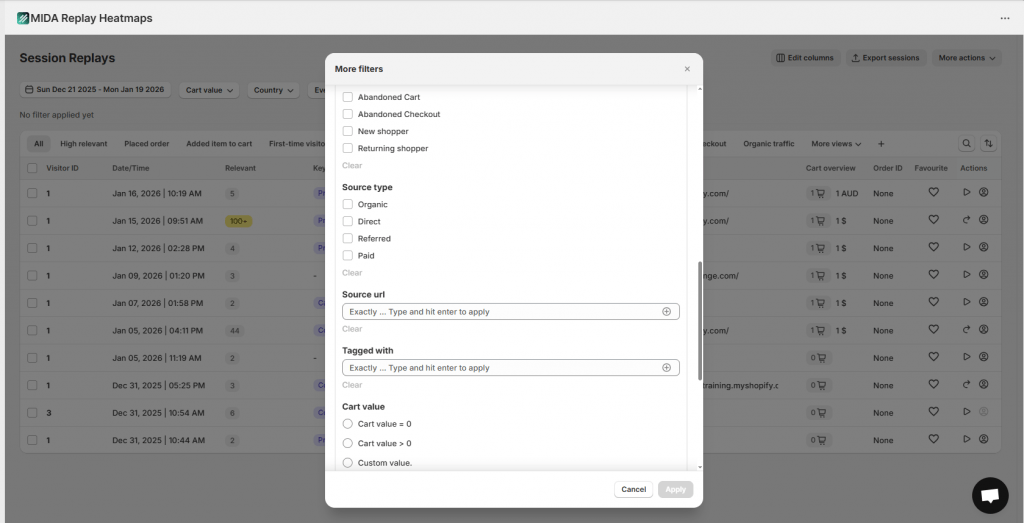
Session replay lets you see what shoppers actually experience—not just that they left, but what happened before they left. Look for behavioral signals like rage clicks (repeated frustrated clicking on elements that don’t respond), hesitation before form fields, and sudden exits.
With MIDA’s session replays, you can filter by abandoned cart or abandoned checkout to watch exactly what went wrong in those high-value moments.
3. Test changes and measure impact
Follow the cycle: identify problem, make targeted change, measure new conversion rate. Testing one change at a time tells you what actually worked, rather than guessing which of several changes made the difference.
How to track conversion rate over time
A single calculation is a snapshot. Tracking trends reveals whether changes help or hurt—and catches problems before they become expensive.
Use consistent time periods (weekly or monthly) and consistent segments for meaningful comparisons. Comparing a holiday week to a normal week, or mixing traffic sources, obscures real patterns.
MIDA’s analytics dashboard tracks conversion metrics automatically, so you can monitor trends without manual calculations or spreadsheet maintenance.
Turn your conversion rate into revenue growth
Conversion rate is a starting point, not an end goal. The real value comes from understanding why shoppers don’t convert and fixing those specific friction points.
Guessing wastes time and resources. You might redesign a product page when the real problem is checkout friction, or speed up your site when the issue is unclear shipping costs.
MIDA connects session replays, heatmaps, and funnel analytics to your Shopify order data—so you can see not just that conversions dropped, but watch the exact moments that caused it.
Try MIDA for free to see exactly where your store loses shoppers and what to fix first.
FAQs about ecommerce conversion rate
How often should you check your ecommerce conversion rate?
Weekly monitoring catches trends early, while monthly reviews provide enough data for meaningful comparisons. The right cadence depends on your traffic volume and how frequently you make site changes—stores running active experiments benefit from more frequent checks.
What is the difference between conversion rate and click-through rate?
Conversion rate measures the percentage of visitors who complete a purchase. Click-through rate measures the percentage of people who click on a link or ad. They track different stages: CTR measures interest in your marketing, while conversion rate measures whether that interest turns into revenue.
Can you calculate conversion rate for specific traffic sources?
Yes. Segment your visitor and order data by source—organic, paid, email, social—and apply the same formula to each segment. This reveals which channels bring purchase-ready shoppers versus browsers who rarely buy.
What conversion rate should a new Shopify store aim for?
New stores typically see lower rates while building trust and refining their experience. Rather than chasing a specific benchmark, focus on improving your own rate over time. A 0.5% improvement from your baseline matters more than hitting an arbitrary industry average.
Does ecommerce conversion rate include returning customers?
Standard conversion rate includes all completed purchases divided by all visitors—both new and returning. You can also calculate separately for each segment to understand how they perform differently. Returning customers typically convert at higher rates since they already trust your brand.

Hien Tran
I’m Hien Tran, a Product Marketing Executive at MIDA, specializing in eCommerce growth and conversion optimization. I focus on bridging product capabilities with real merchant needs—turning insights from heatmaps, session replays, and funnel analytics into actionable strategies that drive measurable results.


