2026 Ecommerce Conversion Funnel Benchmarks and Statistics
Your store converts at 2.3%. Is that good? The answer depends on your industry, device mix, traffic sources, and price point—context that a single benchmark number can’t capture.
This guide breaks down 2026 conversion funnel benchmarks by industry, device, traffic source, and funnel stage, then shows you how to diagnose why your store might fall short and what to do about it.
What is an ecommerce conversion funnel?
Average ecommerce conversion rates sit between 2.5% and 3% globally, with top-performing stores reaching 5% or higher. The typical add-to-cart rate hovers around 6.8%, while cart abandonment averages roughly 76%. Mobile conversion rates (around 2.8%) consistently trail desktop (around 3%), largely because of checkout friction and browsing behavior differences.
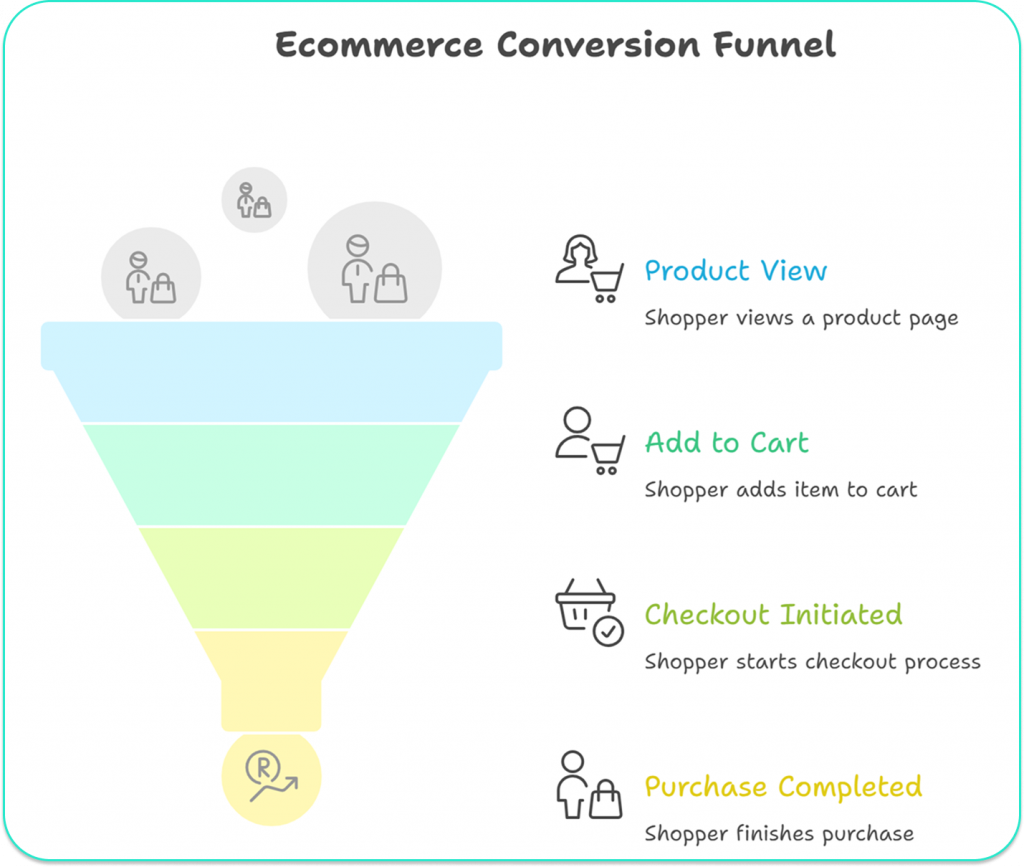
The ecommerce conversion funnel maps the path shoppers take from landing on your store to completing a purchase. Think of it like a physical retail store: people walk in, browse the aisles, pick up items, head to the register, and either buy or walk out. Each step narrows the pool of potential buyers.
The primary stages look like this:
- Product view: A visitor lands on a product page
- Add to cart: They place an item in their shopping cart
- Checkout initiated: They start the checkout process
- Purchase completed: The order goes through
Knowing where shoppers drop off reveals the friction points quietly costing you revenue.
How to calculate ecommerce conversion rate
Ecommerce conversion rate (CVR) is the percentage of visitors who complete a desired action—usually a purchase. The formula is simple:
(Total conversions ÷ Total visitors) × 100 = Conversion Rate %
Sessions vs users in conversion calculations
Here’s where things get tricky. Sessions count individual visits, while users count unique people. One person might visit your store three times before buying—that’s three sessions but only one user.
Using sessions typically produces a lower conversion rate than using users. To compare your numbers against benchmarks accurately, check which metric your analytics platform uses. Otherwise, you’re comparing apples to oranges.
Micro conversions vs macro conversions
Macro conversions are the main goal: completed purchases. Micro conversions are smaller actions along the way—email signups, add-to-carts, wishlist additions.
Tracking both tells you different things. A healthy micro conversion rate paired with a weak macro conversion rate suggests visitors are interested but something blocks the final step. That’s a very different problem than low engagement across the board.
Average ecommerce conversion rate globally
The typical global average falls between 2.5% and 3%, though this number deserves context rather than blind comparison. Your industry, device mix, traffic sources, and price points all shift what “good” looks like for your store.
Global conversion rate benchmarks
Current data shows the global average hovering in that 2.5%–3% range, with high performers reaching 5% or more. However, chasing a single benchmark can mislead you. A luxury furniture store converting at 1.5% might outperform a consumables store at 3% once you factor in average order value and margins.
Year over year conversion rate trends
Average rates have shifted due to competing forces. The explosion of mobile traffic—which converts at lower rates—has pushed overall averages down. Meanwhile, rising shopper expectations for speed and seamless checkout have made converting visitors more challenging.
Ecommerce conversion rate benchmarks by industry
Industry benchmarks vary dramatically based on product type, price point, and purchase complexity. A quick snack purchase requires far less deliberation than a $2,000 sofa.
| Industry | Typical Conversion Rate | Key Factor |
|---|---|---|
| Food & Beverage | 3.0%–5.5% | Lower price, repeat purchases |
| Health & Beauty | 2.5%–4.9% | Brand loyalty, replenishment cycles |
| Fashion & Apparel | 1.5%–2.8% | Sizing concerns, return anxiety |
| Electronics | 1.0%–2.5% | Research-heavy, comparison shopping |
| Home & Furniture | 1.0%–2.5% | High consideration, long cycles |
| Luxury Goods | 0.5%–1.5% | Price, decision complexity |
Food and beverage
Higher conversion rates here make sense—products are consumables with lower price points. Shoppers know what they want, they’ve likely bought it before, and there’s minimal risk involved.
Health and beauty
Strong rates often stem from brand loyalty and emotional connections. Once someone finds a skincare routine that works, they return predictably. Replenishment cycles drive repeat purchases.
Fashion and apparel
Fashion sees moderate rates despite high browsing activity. Sizing uncertainty and return concerns create hesitation. Shoppers often add items to cart, then second-guess whether that medium will actually fit.
Electronics and technology
Research-heavy purchase journeys define this category. Consumers compare specifications across multiple sites, read reviews, and price-shop extensively before committing. The conversion might happen—just not on the first visit.
Home and furniture
Extended consideration cycles and high price points lengthen the journey significantly. A shopper might visit your site six times over two months before finally purchasing that sectional sofa.
Luxury and high ticket goods
Luxury ecommerce operates on a different model: lower conversion volume, much higher order value. Comparing a luxury watch store to a t-shirt brand using the same conversion benchmark misses the point entirely.
Shopify average conversion rate benchmarks
For merchants on Shopify, platform-specific benchmarks offer more relevant comparisons than global averages.
Shopify conversion rates vs global averages
Typical Shopify stores see conversion rates roughly in line with global averages. The platform’s ecosystem—integrated apps, optimized themes, and standardized checkout—creates both advantages and unique friction points worth monitoring.
Shopify checkout completion benchmarks
The Shopify checkout is often the leakiest part of the funnel. Checkout completion rate—the percentage of users who start checkout and finish it—reveals friction that overall conversion rate masks. Even small improvements here translate directly to recovered revenue.
Mobile vs desktop ecommerce conversion rates
The gap between mobile and desktop conversion remains one of the biggest opportunities in ecommerce. Mobile traffic frequently exceeds desktop traffic, yet converts at significantly lower rates.
| Device | Traffic Share | Typical Conversion Rate |
|---|---|---|
| Desktop | ~40% | ~3.0% |
| Mobile | ~55% | ~2.8% |
| Tablet | ~5% | ~2.9% |
Why mobile conversion rates lag desktop
Mobile converts lower for specific, fixable reasons:
- Smaller screens: Harder to view product details and navigate complex pages
- Checkout friction: Filling forms on a small touchscreen invites errors
- Distractions: Notifications and multitasking interrupt the purchase flow
- Trust concerns: Some shoppers feel less comfortable entering payment details on mobile
Tablet conversion rate benchmarks
Tablets typically fall between mobile and desktop. The larger screen offers an experience closer to desktop, reducing the friction that drags mobile rates down.
iOS vs Android conversion differences
Data consistently shows iOS users converting at higher rates than Android users. This difference typically reflects demographic and purchasing power variations between the two user bases rather than platform functionality.
Add to cart and checkout funnel benchmarks
The middle and bottom of the funnel—from adding items to completing purchase—is where most revenue leaks occur.
Average add to cart rate
Add-to-cart rate measures the percentage of visitors who place at least one item in their cart. The benchmark hovers around 6.8%, serving as a key indicator of purchase intent and product page effectiveness.
Cart to checkout conversion benchmarks
A significant drop-off often occurs between adding items and starting checkout. Common causes include unexpected shipping costs revealed in the cart, shoppers using carts as wishlists, or simply not being ready to commit.
Checkout completion rate benchmarks
Checkout completion—the percentage who start checkout and finish—often ranges from 60%–70%. This final step carries the highest friction, and improvements here have the most direct revenue impact.
Abandoned cart vs abandoned checkout rates
Abandoned cart and abandoned checkout indicate different problems:
- Abandoned cart: Items added, but checkout never started. Often signals shipping cost surprises or comparison shopping.
- Abandoned checkout: Checkout started but not completed. Points to friction in the checkout flow itself—required account creation, payment issues, or form complexity.
Distinguishing between them helps you target the right fix.
Ecommerce conversion rates by traffic source
Not all traffic converts equally. Visitors from different sources arrive with vastly different purchase intent.
| Traffic Source | Intent Level | Typical Conversion |
|---|---|---|
| Highest | 4%–5%+ | |
| Organic Search | High | 2%–3% |
| Paid Search | Medium-High | 2%–3% |
| Direct | Medium | 2%–3% |
| Social | Lower | 1%–2% |
Email traffic conversion rates
Email consistently produces the highest conversion rates. Visitors from email already know your brand, have opted into communication, and often click through with specific purchase intent.
Organic search conversion rates
Organic search traffic converts well because it indicates active intent. Someone searching for “waterproof hiking boots size 10” is further along the buying journey than someone scrolling Instagram.
Paid search and social conversion rates
Paid channels bring targeted but often colder traffic. Conversion rates vary significantly based on ad creative quality, landing page relevance, and audience targeting precision.
Direct and referral traffic benchmarks
Direct traffic—visitors typing your URL directly—often consists of returning customers and converts reliably. Referral traffic varies wildly depending on the referring source’s context and authority.
Trends affecting ecommerce conversion rates
Several current trends are actively shifting baseline benchmarks.
Buy now pay later and payment flexibility
Offering BNPL options like Klarna or Afterpay can improve checkout completion by reducing price objection friction, particularly for higher-ticket items.
Site speed and Core Web Vitals
Slow pages directly hurt conversion. Each second of delay increases bounce rates and cart abandonment. Site speed has moved from technical concern to core user experience factor.
AI personalization and recommendations
AI-powered product recommendations can lift conversion rates by showing shoppers relevant items based on browsing behavior—helping them discover products they’re more likely to buy.
Mobile first shopping behavior
The continued shift toward mobile-first browsing puts constant pressure on overall conversion averages. Stores that fail to optimize for seamless mobile experiences will see their benchmarks suffer.
Why your conversion funnel may underperform benchmarks
Knowing benchmarks is one thing. Diagnosing why you’re falling short requires looking at actual visitor behavior.
Behavioral signals that indicate funnel friction
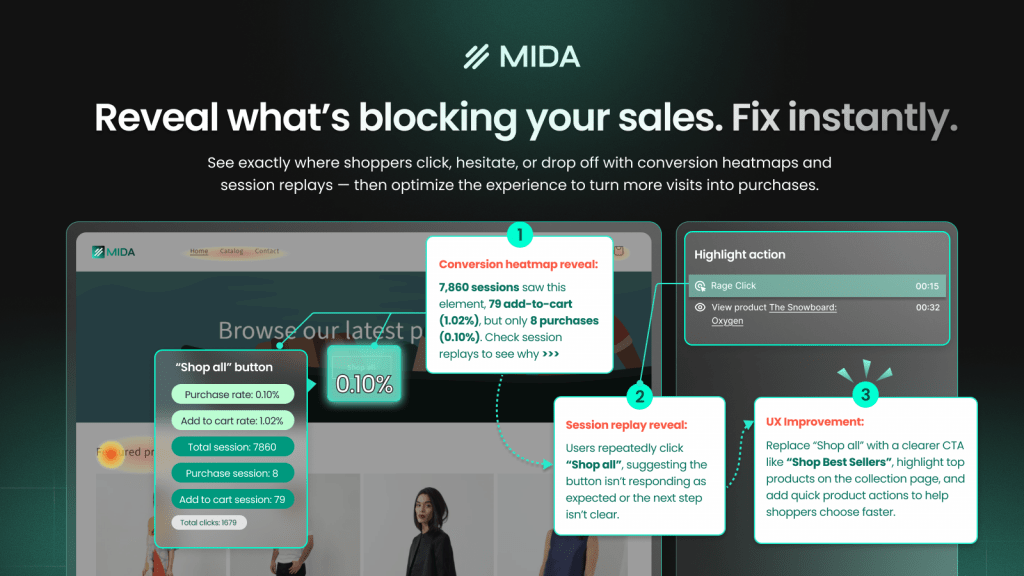
Certain behaviors signal friction clearly. Session replay and heatmap tools reveal patterns that aggregate analytics miss:
- Rage clicks: Repeated, rapid clicking on an element that isn’t responding—a clear frustration signal
- Dead clicks: Clicks on non-interactive elements like images or text, indicating confusing design
- Hesitation patterns: Long pauses or erratic mouse movements before form fields, suggesting uncertainty
Common funnel drop off points and causes
Typical friction points include product pages with missing information or low-quality images, cart pages with surprise shipping costs or confusing layouts, and checkout flows with too many steps or required account creation.
New vs returning visitor conversion gaps
New visitors almost always convert at significantly lower rates than returning customers. Segmenting your data by visitor type is essential for setting realistic benchmarks—a store with 90% new traffic will naturally show lower overall conversion than one with 50% returning customers.
How to improve ecommerce funnel conversion rates
Once you’ve benchmarked performance, practical improvements become possible.
1. Identify friction points in your funnel
Start by diagnosing exactly where drop-offs occur. Use funnel visualization to see which step loses the most shoppers. Then watch actual session recordings to understand the “why” behind the numbers—seeing a visitor struggle with your size chart reveals more than knowing 40% left the product page.
2. Simplify checkout and enable guest checkout
Reduce steps and form fields. Forcing account creation is one of the biggest conversion killers. A prominent guest checkout option removes friction that costs you completed orders.
3. Optimize product pages for conversion
Equip product pages to convert: high-quality zoomable images, complete descriptions, visible pricing, and trust signals like reviews and security badges.
4. Improve site speed and mobile experience
Address Core Web Vitals issues to ensure fast page loads. Test your entire checkout flow on multiple mobile devices—this is where friction hides most often.
5. Add trust signals and social proof
Reduce purchase anxiety with customer reviews, security badges, clear return policies, and user-generated content.
6. Personalize product recommendations
Use browsing behavior to show relevant recommendations. Personalization increases add-to-cart rates and average order value by helping shoppers discover products aligned with their interests.
How to measure funnel conversion rates accurately
Accurate measurement comes before meaningful benchmarking.
Platform analytics vs third party tools
Your platform’s native analytics may report different numbers than third-party tools due to tracking methodology differences. Choose one source of truth and stick with it for consistent benchmarking.
Segmenting by visitor type and device
Break down overall conversion rate by key segments: new vs. returning visitors, device type, and traffic source. Aggregate numbers hide important patterns that segmented data reveals.
Connecting behavior data to revenue outcomes
The most powerful analysis links qualitative behavior data to quantitative outcomes. Connecting session recordings to actual orders and abandoned carts shows exactly what happened before each conversion or drop-off—moving from “something’s wrong” to “here’s the exact moment it happened.”
Try MIDA for free to see how connecting behavior to revenue changes the way you optimize your funnel.
FAQs about ecommerce conversion funnel benchmarks
What is a good conversion rate for a new ecommerce store?
New stores typically see lower conversion rates while building traffic quality and brand trust. Rather than chasing industry averages immediately, focus on month-over-month improvement. A new store converting at 1% that improves to 1.5% is making meaningful progress.
How long should you track conversion data before comparing to benchmarks?
Collect data for at least one full sales cycle—typically a minimum of 30 days. This ensures statistically meaningful data and accounts for weekly fluctuations in traffic and buying behavior.
Does average order value affect what conversion rate you should target?
Absolutely. Stores with high average order value can be highly profitable even with low conversion rates. A 1% conversion rate on $500 orders generates more revenue than 3% on $50 orders.
How do subscription ecommerce conversion rates compare to one time purchases?
Subscription models often show lower initial conversion rates because the commitment is higher. However, they benefit from much higher customer lifetime value, making direct benchmark comparisons with traditional ecommerce misleading.
What is a good add to cart rate for ecommerce stores?
A healthy add-to-cart rate typically falls between 5%–10%, varying by industry. It’s a key metric for measuring purchase intent before checkout friction begins.
How much traffic do you need to accurately benchmark funnel performance?
You need sufficient volume at each funnel stage to identify statistically significant patterns. Low-traffic stores benefit more from qualitative analysis—watching individual session recordings—rather than relying solely on percentage-based metrics that can mislead with small sample sizes.


