Ecommerce Conversion Funnel Examples: Proven Frameworks for 2026
Your store gets traffic, but most visitors leave without buying. The gap between “added to cart” and “completed purchase” is where revenue disappears—and without visibility into that gap, you’re optimizing blind.
This guide breaks down how ecommerce conversion funnels work, which metrics actually matter, and how to diagnose the specific friction points costing your store sales.
What Is an Ecommerce Conversion Funnel
An ecommerce conversion funnel maps the customer journey from initial brand awareness to final purchase, typically involving four key stages: Awareness, Interest, Desire, and Action. Picture a physical store—plenty of people walk past the window, fewer step inside, and only a fraction actually buy something. The funnel shape reflects this natural narrowing, wide at the top where visitors enter and progressively narrower as people drop off at each stage.
The average ecommerce conversion rate sits between 2.5% and 3%, meaning roughly 97 out of every 100 visitors leave without purchasing. Understanding where those 97 people exit—and why—is exactly what funnel analysis reveals.
Why Your Ecommerce Funnel Directly Affects Revenue
Without visibility into where shoppers drop off, conversion rate optimization becomes guesswork. You might redesign your homepage when the real problem is a confusing checkout flow, or invest in more traffic when your product pages aren’t converting the visitors you already have.
Cart abandonment and checkout abandonment are symptoms, not root causes. The funnel framework helps you trace those symptoms back to specific friction points—a missing size guide, unexpected shipping costs, or a form field that breaks on mobile.
Once you can see the problem, you can fix it. Until then, you’re hoping changes work.
The Four Stages of an Ecommerce Sales Funnel
Most ecommerce funnels follow four distinct stages, each defined by different visitor intent. Friction looks different at each stage, and so do the fixes.
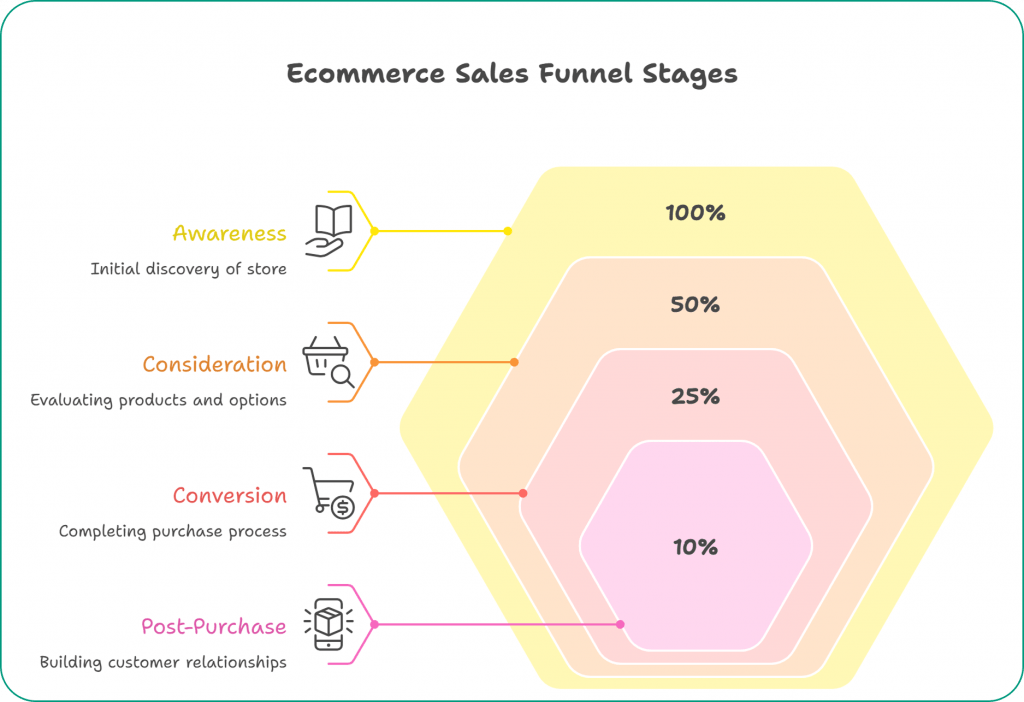
Awareness Stage
The Awareness Stage is when a shopper first discovers your store through ads, search results, social media, or word of mouth. At this point, they may not even know they have a problem your product solves.
Your goal here is attracting qualified traffic—people who might actually want what you sell. This is the widest part of the funnel, and the quality of visitors you attract determines everything downstream.
Consideration Stage
The Consideration Stage is when shoppers actively browse products, compare options, and evaluate whether to buy from you. Common behaviors include viewing multiple product pages, reading reviews, and checking sizing information.
This is where trust gets built or broken. If visitors can’t find the information they’re looking for—or if the information raises more questions than it answers—they leave.
Conversion Stage
The Conversion Stage covers every step from “add to cart” through payment completion. This is where cart abandonment and checkout abandonment happen, and it’s typically where the most revenue leaks occur.
Even small friction points compound here. A required account creation, an unexpected fee, a form that doesn’t autofill correctly on mobile—each one gives shoppers a reason to reconsider.
Post-Purchase Stage
The Post-Purchase Stage includes everything after the order: confirmation emails, shipping updates, delivery experience, and follow-up communication. While it doesn’t directly affect the initial conversion, it heavily influences whether customers return.
Repeat customers convert at significantly higher rates than new visitors. The post-purchase experience is where you build the relationship that drives future purchases.
Ecommerce Conversion Funnel Benchmarks by Industry
Benchmarks help you set realistic expectations, though “good” varies significantly by industry, product type, and traffic source.
| Industry | Typical Conversion Rate |
|---|---|
| Fashion & Apparel | 1.5% – 2.5% |
| Electronics | 1% – 2% |
| Health & Beauty | 2.5% – 3.5% |
| Food & Beverage | 3% – 5% |
| Luxury Goods | 0.5% – 1.5% |
Your own historical data matters more than industry averages. A store converting at 1.8% that improves to 2.2% has made meaningful progress, regardless of what competitors achieve. Compare against your past performance first, then use benchmarks for context.
Funnel Conversion Metrics to Track
The right metrics reveal exactly where your funnel leaks revenue.
Conversion Rate
The percentage of visitors who complete a purchase. This is your overall funnel health indicator—if it’s declining, something upstream is broken.
Add to Cart Rate
The percentage of visitors who add at least one item to their cart. A low add-to-cart rate often signals problems with product pages: unclear pricing, missing information, or images that don’t build confidence.
Cart Abandonment Rate
The percentage of shoppers who add items but leave before starting checkout. This rate indicates friction between browsing intent and buying intent.
Checkout Abandonment Rate
The percentage of shoppers who start checkout but don’t complete payment. Common causes include unexpected shipping costs, required account creation, and payment processing issues.
Average Order Value
The average revenue per completed order. Changes to your funnel can affect not just whether people buy, but how much they spend when they do.
Customer Lifetime Value
The total revenue a customer generates over their entire relationship with your store. This metric connects post-purchase experience directly to long-term revenue and helps justify acquisition costs.
How to Analyze Your Ecommerce Funnel
Analyzing your funnel means finding drop-off points and understanding why they happen.
1. Map Your Full Funnel From First Visit to Purchase
Document every step a visitor takes: landing page, product page, cart, checkout steps, and order confirmation. Be specific—if your checkout has three pages, list all three. You can’t optimize what you haven’t mapped.
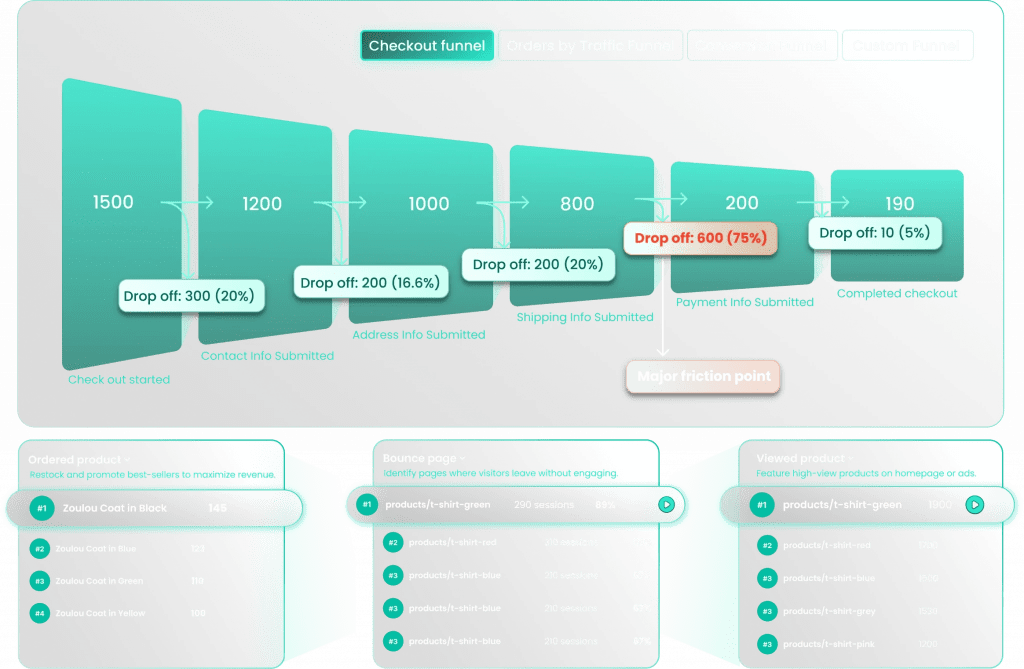
2. Identify Your Biggest Drop-Off Points
Look for stages with the steepest visitor losses. If 60% of visitors who add to cart never start checkout, that transition deserves attention before you worry about smaller leaks elsewhere.
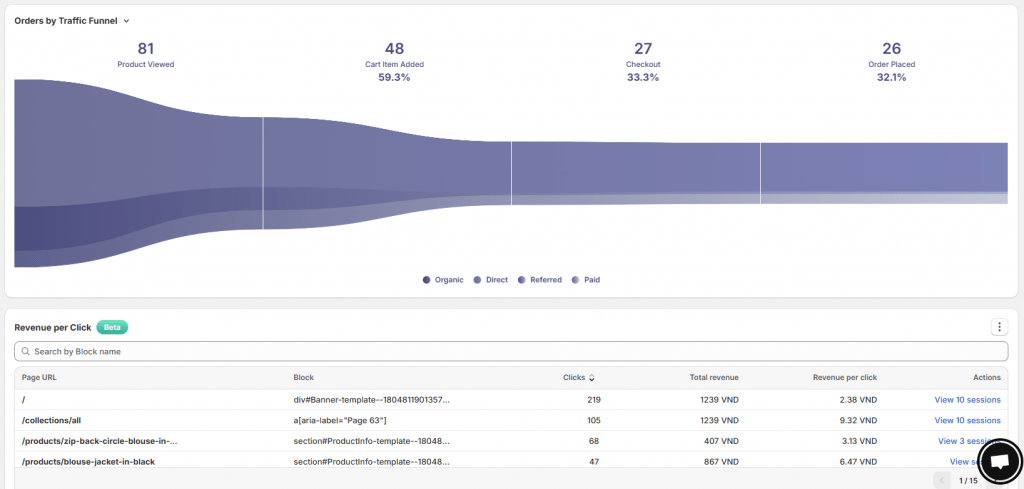
3. Segment by Traffic Source and Device
Compare funnel performance across channels (organic, paid, social) and devices (desktop, mobile, tablet). If your mobile checkout is particularly painful, aggregate data will hide that insight until you segment.
4. Watch Real Sessions to Understand Why Visitors Leave
Aggregate data shows where drop-offs happen. Session recordings show why.
Watch for behavioral signals like rage clicks (repeated frustrated clicking on elements that don’t respond), hesitation on form fields, and repeated scrolling that suggests confusion. Tools like MIDA let you watch the exact session behind an abandoned cart, so you see the specific moment a shopper gave up.
Proven Tactics to Optimize Each Funnel Stage
Funnel optimization means reducing friction at each stage.
Awareness Stage Optimization
Focus on attracting visitors whose intent matches what you sell. Highly targeted ads, search optimization for relevant keywords, and content that addresses real customer questions all help ensure the people entering your funnel are actually potential buyers.
Misaligned traffic creates the illusion of a funnel problem when it’s really an audience problem.
Consideration Stage Optimization
- Clear product information: Detailed descriptions, sizing guides, and high-quality images reduce uncertainty that causes visitors to leave and “think about it.”
- Social proof: Reviews and ratings displayed prominently build trust during evaluation.
- Easy comparison: Features that help shoppers evaluate options without leaving your site keep them engaged longer.
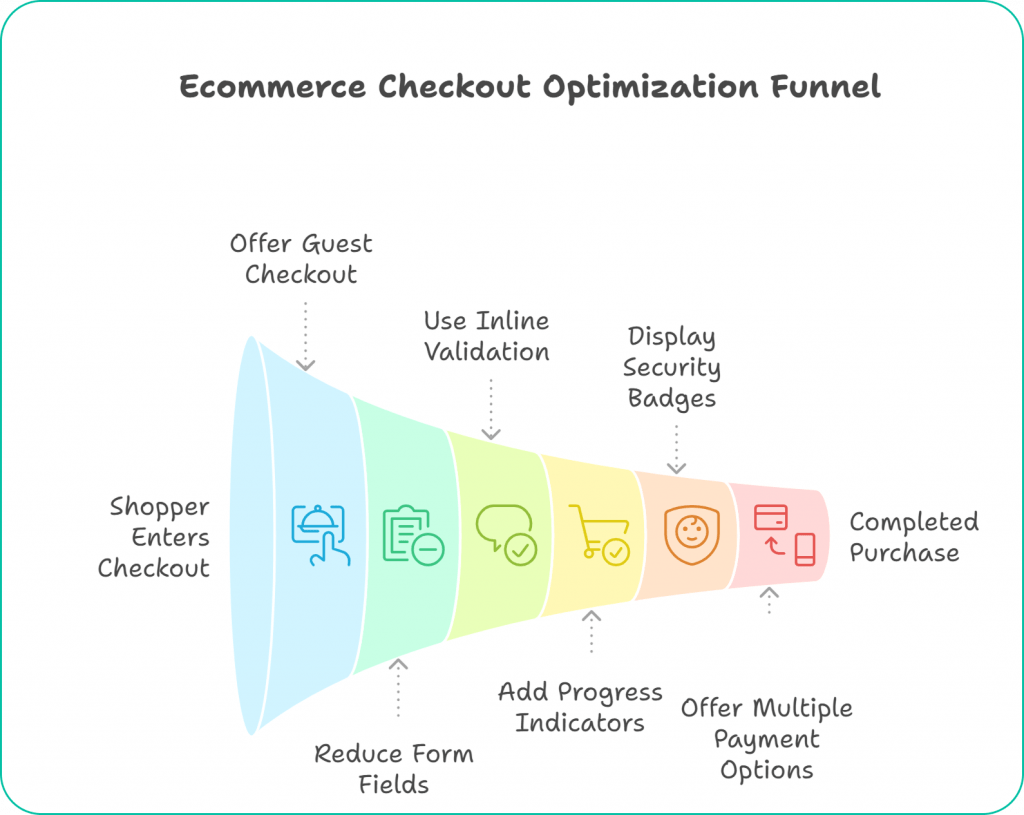
Conversion Stage Optimization
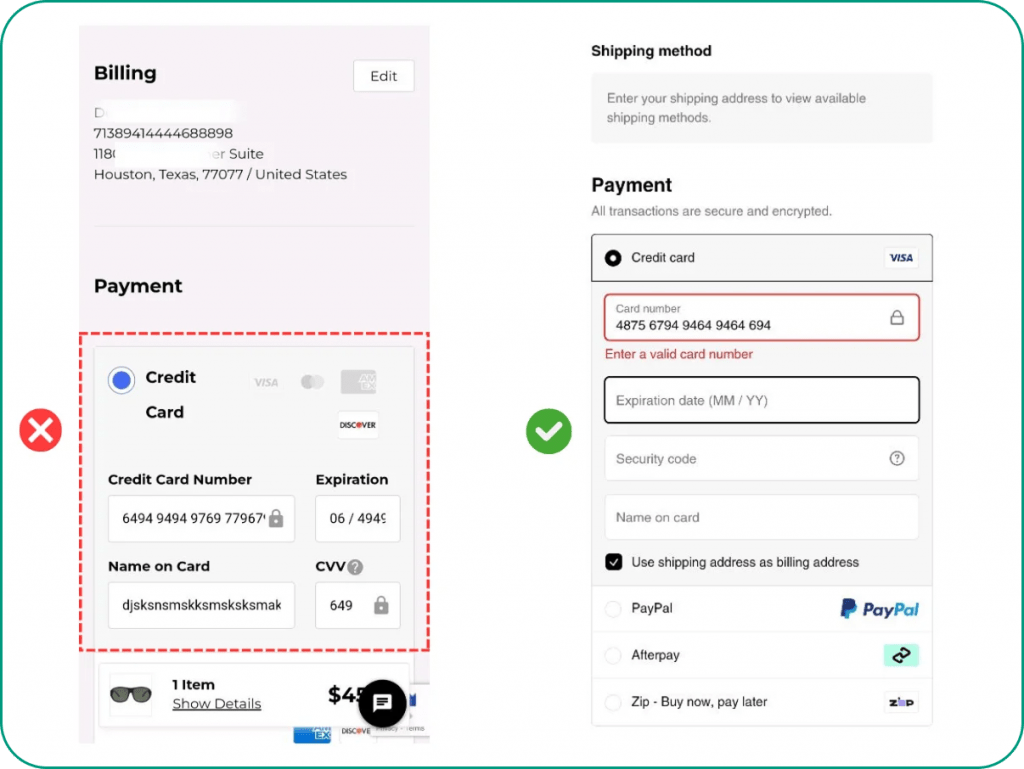
- Streamlined checkout: Fewer form fields and steps mean fewer opportunities to abandon.
- Transparent pricing: Show shipping costs and taxes early—surprise fees at the final step are a leading cause of checkout abandonment.
- Multiple payment options: Offer payment methods your customers already trust and use.
- Guest checkout: Forcing account creation before purchase adds friction that many shoppers won’t tolerate.
Post-Purchase Stage Optimization
Clear confirmation emails, proactive shipping updates, and thoughtful follow-up communication turn one-time buyers into repeat customers. This is also where loyalty programs and subscription options can extend customer lifetime value.
Ecommerce Funnel Optimization Best Practices
The following practices apply across all funnel stages.
Simplify Navigation and Reduce Steps
Every extra click is an opportunity to lose a visitor. Regularly audit your funnel to identify unnecessary steps—that “confirm your selections” page might feel thorough, but it’s also another chance for someone to reconsider.
Use Clear Calls to Action
Buttons and links with vague language (“Submit,” “Continue”) create hesitation. Clear, specific CTAs (“Add to Cart,” “Complete Purchase”) tell visitors exactly what happens next.
Optimize Your Checkout Funnel for Mobile
Mobile shoppers deal with smaller screens and touch input. Forms that work fine on desktop can become frustrating on phones—tiny tap targets, keyboards that don’t match input types, and slow load times all compound on mobile.
Add Social Proof at Key Decision Points
Place reviews, trust badges, and customer photos where shoppers are most likely to hesitate: product pages, cart, and checkout. Social proof works best when it appears at the moment of doubt.
Test Changes and Measure Results
Optimization is iterative. Make one change, measure its impact, then move to the next test. Changing multiple elements simultaneously makes it impossible to know what actually worked.
Why Behavior Analytics Reveals Friction Standard Tools Miss
Standard analytics tools like Google Analytics show what happened—pageviews, bounce rates, conversion percentages. Behavior analytics tools show why it happened.
- Session replays: Watch actual visitor sessions to see exactly where someone paused, scrolled back up in confusion, or rage-clicked on a button that didn’t respond.
- Heatmaps: Reveal which page elements get attention and which get ignored entirely.
- Click maps: Show dead clicks—clicks on elements that aren’t actually clickable, signaling visitor confusion about your interface.
The difference matters because the “what” rarely tells you how to fix the problem. Knowing that 40% of visitors abandon at checkout step two doesn’t tell you whether it’s the shipping calculator, the form layout, or the payment options causing the issue. Watching those sessions does.
MIDA connects behavioral insights directly to orders and abandoned carts, so you can prioritize fixes based on actual revenue impact rather than guessing which problems matter most.
Turn Funnel Insights Into Measurable Revenue Gains
The goal is a continuous loop: see the friction, understand its cause, fix the problem, and measure the improvement. Funnel optimization isn’t a one-time project—it’s an ongoing practice that compounds over time.
Start with your biggest drop-off point. Watch sessions to understand what’s happening. Make a targeted fix. Measure whether the drop-off rate improves. Then move to the next problem.
Try MIDA for free to see how connecting behavior to revenue changes the way you optimize your store.
FAQs About Ecommerce Conversion Funnels
What is a good ecommerce conversion rate?
A “good” rate depends entirely on your industry, traffic sources, and product type. The 2.5%–3% average is just a reference point. The more useful question is whether your rate is improving over time—compare against your own historical performance rather than chasing an arbitrary benchmark.
What is the difference between a checkout funnel and a full conversion funnel?
A checkout funnel tracks only the final purchase steps, from cart through payment completion. A full ecommerce conversion funnel includes the entire journey, from first visit through post-purchase experience. Both are useful, but they answer different questions.
How long does ecommerce funnel optimization take to show results?
You can often see measurable changes within a few weeks of fixing high-impact friction points. However, optimization works best as a continuous practice—customer behavior evolves, your store changes, and new friction points emerge over time.
What causes customers to abandon their cart before checkout?
Common causes include unexpected shipping costs, required account creation, complicated navigation, slow page loads, and missing preferred payment methods. The specific cause varies by store, which is why watching session recordings reveals problems that aggregate data can’t explain.


