Checkout Conversion Rate Benchmarks for Ecommerce 2026
Checkout conversion rate measures the percentage of shoppers who start your checkout process and actually complete a purchase. For most ecommerce stores, that number falls between 20% and 40%—meaning the majority of shoppers who begin checkout never finish it.
This guide covers current benchmarks by industry, device, and traffic channel, the most common reasons shoppers abandon at checkout, and how to diagnose the specific friction points costing your store revenue.
What Is Checkout Conversion Rate
Average ecommerce checkout completion rates typically range between 20% and 40%. That means 60% to 80% of shoppers who start checkout abandon it before completing their purchase. A “good” benchmark exceeds 40%, with top-performing stores reaching higher.
This metric differs from your overall site conversion rate, which measures all visitors who make a purchase. Checkout conversion rate focuses specifically on shoppers who’ve already committed enough to start the checkout process.
Picture a customer who adds items to their cart, clicks through to checkout, begins entering their shipping address, then closes the tab. That’s a failed checkout conversion. The shopper demonstrated clear purchase intent but encountered something that stopped them at the final step.
Average Checkout Conversion Rate for Ecommerce
Global Ecommerce Conversion Rate
The average ecommerce conversion rate sits between 2.5% and 3% globally, though regional differences are significant. The Americas lead at around 3.14%, followed by EMEA at 2.78%, and APAC at 1.83%.
| Region | Average Conversion Rate |
|---|---|
| Americas | 3.14% |
| EMEA | 2.78% |
| APAC | 1.83% |
Your store’s geographic traffic mix directly impacts what “average” looks like for you.
Average Add-to-Cart Rate
The add-to-cart rate measures the percentage of visitors who add at least one item to their cart. This typically ranges from 7% to 15% depending on industry and traffic quality.
Think of this as the first filter in your conversion funnel. A low add-to-cart rate suggests problems with product pages, pricing visibility, or traffic quality. A healthy add-to-cart rate combined with poor checkout conversion tells you the friction lives further down the funnel.
Average Checkout Completion Rate
Checkout completion rate is the percentage of shoppers who start checkout and finish it. Well-optimized stores typically see rates between 45% and 55%. The inverse is your checkout abandonment rate, which hovers around 70% for most ecommerce sites.
This metric isolates the checkout experience from everything else. When you see a gap between your add-to-cart rate and completed purchases, checkout completion rate helps you understand how much of that gap lives within the checkout flow versus earlier in the journey.
Checkout Conversion Rate Benchmarks by Industry
Conversion rates vary dramatically by what you sell. Complex, high-consideration purchases naturally see lower conversion than routine, necessity-driven ones.
| Industry | Average Conversion Rate |
|---|---|
| Food & Beverage | 6.17% |
| Health & Beauty | 5.10% |
| Fashion & Apparel | 4.07% |
| Electronics | 3.60% |
| Pet Care | 2.67% |
| Home & Furniture | 1.42% |
Fashion and Apparel
Fashion stores typically convert around 4.07% of visitors. The high browse-to-buy ratio reflects how shoppers interact with clothing—often browsing for inspiration rather than purchasing with intent. Sizing uncertainty drives significant abandonment in this category.
Health and Beauty
Health and beauty achieves higher conversion rates around 5.10%, driven largely by repeat purchases and subscription models. Once a customer finds a product that works, they return. The consumable nature of these products creates natural repurchase cycles.
Electronics and Technology
Electronics conversion rates sit around 3.60%, lower than many categories due to higher price points and longer consideration cycles. Shoppers compare across multiple retailers before committing, so many visitors are gathering information rather than ready to buy.
Home and Garden
Home and furniture sees the lowest conversion rates at around 1.42%. Higher average order values and seasonal purchasing patterns both contribute. These purchases often require more consideration—measuring spaces, coordinating with partners, waiting for the right moment.
Food and Beverage
Food and beverage leads with conversion rates around 6.17%. Necessity-driven purchases and repeat buying behavior both contribute. When shoppers arrive at a food site, they’re typically ready to buy with less comparison shopping.
Checkout Conversion Rate Benchmarks by Device
A significant gap exists between desktop and mobile checkout conversion. Understanding this gap reveals one of the biggest optimization opportunities for most stores.
| Device | Average Conversion Rate | Traffic Share |
|---|---|---|
| Desktop | 3.5% – 4.0% | Declining |
| Mobile | 1.8% – 2.5% | Growing |
| Tablet | 3.0% – 3.5% | Stable |
Desktop Checkout Conversion
Desktop typically achieves the highest checkout conversion rates, ranging from 3.5% to 4.0%. Larger screens make form completion easier, and desktop sessions often indicate higher purchase intent. Shoppers who sit down at a computer to make a purchase are often further along in their decision process.
Mobile Checkout Conversion
Mobile conversion lags significantly at 1.8% to 2.5%, despite mobile traffic now exceeding desktop for most stores. The friction comes from multiple sources:
- Smaller screens: Forms are harder to complete
- Difficult typing: More errors and frustration
- More distractions: Notifications, multitasking, on-the-go browsing
Yet mobile traffic continues to grow, making mobile checkout optimization increasingly critical.
Tablet Checkout Conversion
Tablet conversion falls between desktop and mobile at 3.0% to 3.5%. User behavior on tablets more closely resembles desktop—shoppers are often at home, browsing with intent. The larger screen eliminates many mobile friction points while maintaining portability.
Checkout Conversion Rate Benchmarks by Traffic Channel
Different traffic sources bring shoppers with different levels of purchase intent.
Organic Search Traffic
Visitors from organic search often arrive with research-focused intent. They’re looking for information, comparing options, or just beginning their purchase journey. This typically produces lower initial conversion rates compared to other channels. However, organic visitors who do convert often become higher-quality customers with better lifetime value.
Paid Advertising Traffic
Paid traffic conversion depends heavily on alignment between ad creative and landing page experience. When the promise matches the delivery, conversion rates can exceed organic traffic. Misalignment creates problems—shoppers who click expecting one thing and find another abandon quickly.
Direct and Email Traffic
Direct and email traffic typically achieve the highest conversion rates. These visitors already know your brand and often arrive with specific purchase intent. Email traffic in particular represents shoppers who’ve opted into your communication—warmer leads by definition.
Social Media Traffic
Social media traffic generally converts at lower rates because users are often in discovery mode rather than purchase mode. They’re scrolling, exploring, and saving for later. This doesn’t make social traffic worthless—it often introduces new customers who convert on subsequent visits through other channels.
Shopify Average Ecommerce Conversion Rate Benchmarks
Shopify stores specifically see average conversion rates between 1.3% and 1.5%, with top-performing stores reaching 3% or higher. These benchmarks account for the platform’s mix of store sizes, industries, and maturity levels.
Shopify-native analytics tools can track these metrics with precision, connecting conversion data directly to customer profiles and order outcomes. This integration lets you move from aggregate numbers to specific sessions—seeing exactly what happened before a completed purchase or abandoned checkout.
How to Calculate Checkout Conversion Rate
Checkout Conversion Rate Formula
Checkout Conversion Rate = (Completed Purchases ÷ Checkout Sessions) × 100
If 100 shoppers started checkout last week and 46 completed their purchase, your checkout conversion rate is 46%. This calculation requires tracking checkout initiations separately from cart additions.
Checkout Completion Rate Formula
A related but distinct metric:
Checkout Completion Rate = (Completed Purchases ÷ Checkout Starts) × 100
The difference is subtle but important. Checkout sessions might count repeat visits to checkout, while checkout starts counts unique checkout initiations. Clarify which your analytics platform uses.
>> Try our Ecommerce Conversion Rate Calculator for free!
What Is a Good Checkout Conversion Rate
“Good” depends entirely on your context. A 40% checkout completion rate might be excellent for a luxury furniture store and concerning for a consumables brand. The most useful comparison is against your own historical performance.
- Industry context: Compare your rate to your specific vertical, not all ecommerce
- Device breakdown: Evaluate mobile and desktop separately—a blended number hides important details
- Traffic quality: Higher-intent sources like email and direct traffic convert better by nature
- Trend over time: Your own improvement trajectory matters more than hitting an arbitrary benchmark
Common Causes of Low Checkout Conversion
Knowing your benchmark is only useful if you can identify the conversion killers dragging your rate down.
Unexpected Shipping Costs
This remains the top reason shoppers abandon checkout. They’ve mentally committed to a price, then discover additional costs that change the equation. A shopper adds a $50 item, proceeds to checkout, sees $15 shipping appear for the first time, and closes the tab.
Complex Checkout Forms
Too many fields, confusing layouts, or unclear progress indicators all create friction. Each additional field is an opportunity for the shopper to reconsider. Behavioral signals of this issue include rage clicks on form fields and long pauses between steps.
Limited Payment Options
Failing to offer preferred payment methods loses ready-to-buy shoppers. Buy Now, Pay Later options, digital wallets like Apple Pay, and region-specific payment methods all matter. A shopper who reaches payment and doesn’t see their preferred option faces a choice: find their credit card or leave.
Security Concerns and Missing Trust Signals
First-time visitors to unfamiliar stores are naturally skeptical. Missing trust signals—security badges, recognizable payment logos, clear return policies—create hesitation. Hesitation at the payment step often becomes abandonment.
Slow Checkout Page Speed
Every second of load time increases abandonment. Mobile users are especially sensitive to delays, and a slow-loading checkout page signals an unreliable experience.
Poor Mobile Checkout Experience
Given the mobile conversion gap, this deserves specific attention. Small tap targets, hard-to-complete forms, and layouts that require pinching and zooming all compound on mobile devices.
Forced Account Creation
Requiring shoppers to create an account before purchasing adds friction at exactly the wrong moment. They want to complete a transaction, not commit to a relationship. Guest checkout removes this barrier.
How to Diagnose Checkout Conversion Problems
Benchmarks tell you IF you have a problem. Diagnosis tells you WHERE and WHY.
Analyze Your Checkout Funnel
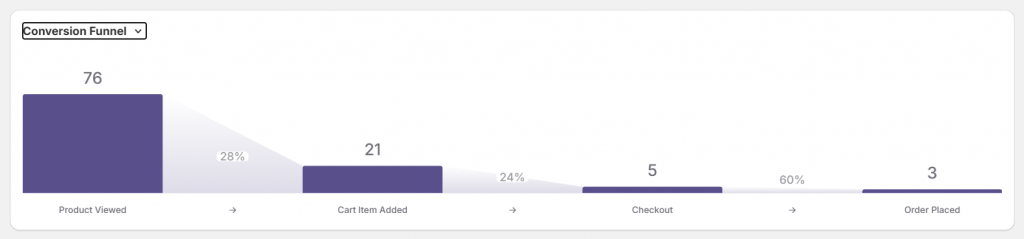
Funnel visualization shows exactly where shoppers exit between key steps: product view → add to cart → checkout initiated → purchase complete. A big drop between “add to cart” and “checkout initiated” suggests different issues than a drop between “payment info” and “purchase complete.”
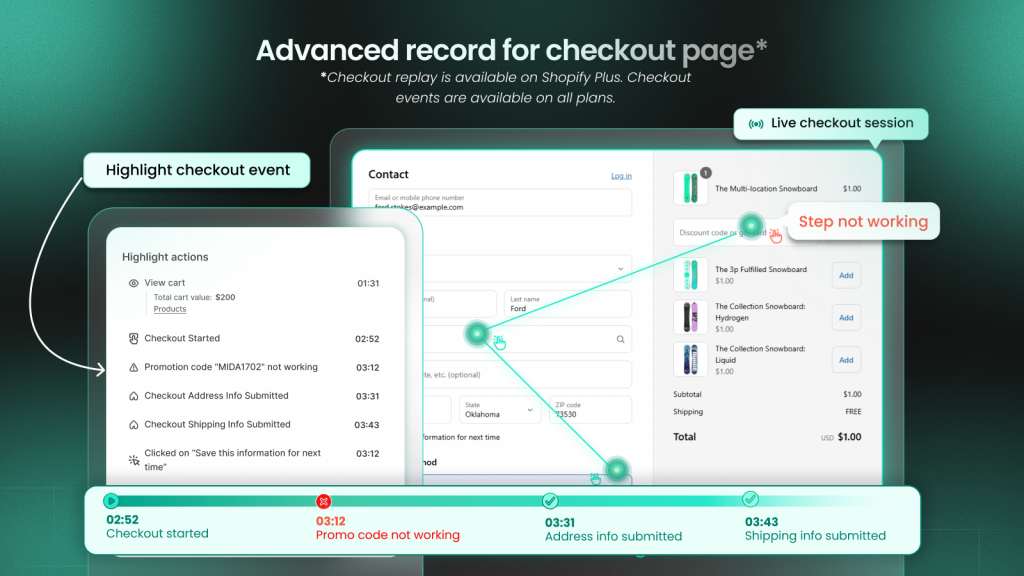
Watch Session Replays of Checkout Abandoners
Session recordings let you watch real shopper behavior leading up to abandonment. You see where they paused, what they clicked, where they seemed confused, and the exact moment they left.
Tools like MIDA let you filter recordings to show only abandoned checkout sessions. Look for hesitation patterns, confusion at specific form fields, or moments where shoppers scroll searching for information.
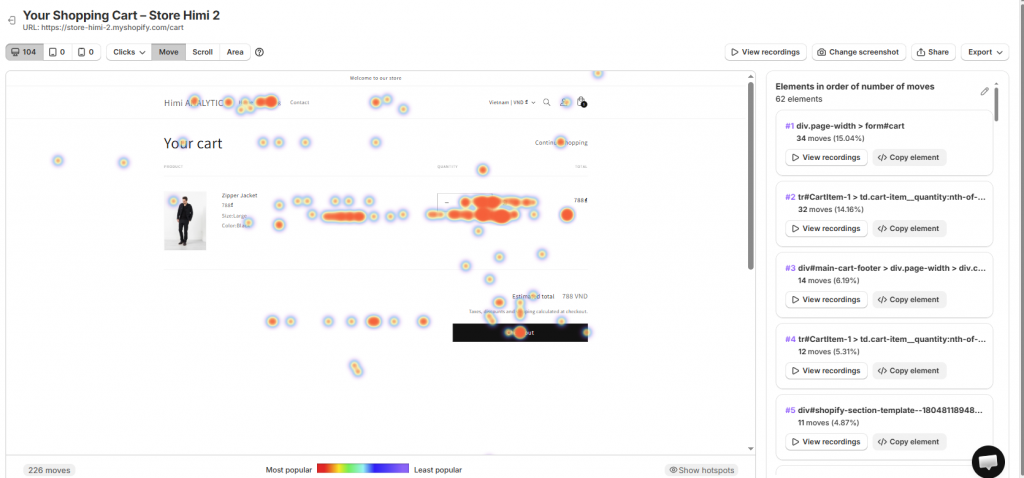
Use Heatmaps on Checkout Pages
Heatmaps aggregate behavior across many visitors to show patterns. Click maps reveal where shoppers are clicking—including dead clicks on non-clickable elements. Scroll maps show how far down the page visitors actually go.
If your shipping information sits below where most shoppers scroll, they might be abandoning because they never saw it.
Track Element-Level Interactions
Page-level data tells you a page has problems. Element-level data tells you which specific button, form field, or section is causing friction. Knowing that 40% of abandoners hesitate at the shipping address field is more actionable than knowing they abandoned somewhere in checkout.
Identify Rage Clicks and Frustration Signals
Rage clicks are repeated clicking on non-responsive elements. Dead clicks are clicks on elements that don’t do anything. Both indicate UX problems you might otherwise miss—a button that looks clickable but isn’t, a form field that’s hard to select on mobile, a loading spinner that seems stuck.
How to Improve Your Checkout Conversion Rate
1. Streamline the Checkout Flow
Reduce the number of steps and pages. A single-page checkout often outperforms multi-step processes, though this varies by audience. Remove optional fields entirely rather than marking them optional.
2. Display Shipping Costs Early
Show shipping estimates on product pages or within the cart. When shoppers know the full cost before checkout, the final total isn’t a surprise. Free shipping thresholds displayed prominently can also increase average order value while reducing abandonment.
3. Offer Guest Checkout
Allow purchases without account creation. The option to create an account can come after the purchase, when the shopper has already demonstrated trust. Forced registration is consistently cited as a top abandonment reason.
4. Add Multiple Payment Options
Include digital wallets, BNPL options, and region-appropriate payment methods. Shop Pay, Apple Pay, and similar options also speed up checkout by eliminating form entry.
5. Optimize for Mobile Devices
Design for small screens with larger buttons, autofill-friendly forms, and simplified layouts. Test on actual devices, not just browser preview modes. Given the mobile conversion gap, improvements here often yield significant results.
6. Show Trust Signals and Security Badges
Place SSL indicators, payment provider logos, and guarantee badges prominently—especially near the payment button where doubt is highest. Clear return policies and contact information also build confidence for first-time buyers.
7. Reduce Form Fields
Only ask for essential information. Use address autocomplete to minimize typing. Consider whether you really need a phone number, company name, or separate billing address.
8. Test Single-Page vs Multi-Page Checkout
Neither layout is universally better. On mobile, progressive multi-page checkouts often perform better. Test both with your audience and use session data to understand why one outperforms the other.
Trends Affecting Checkout Conversion Rates
Mobile Traffic Growth
Mobile traffic continues to grow as a share of total ecommerce visits. This makes mobile checkout optimization increasingly critical—the conversion gap between mobile and desktop represents growing lost revenue as traffic shifts.
Buy Now Pay Later Adoption
BNPL options are becoming an expected feature, especially for retailers with higher average order values. Shoppers increasingly look for these options and may abandon if they’re not available.
Rising Site Speed Expectations
Core Web Vitals and general shopper impatience mean page speed impacts conversion more than ever. What felt acceptable two years ago now feels slow.
Start Turning Checkout Benchmarks into Revenue
Benchmarks give you context. Real improvement comes from diagnosing and fixing specific friction points in your store’s checkout.
The connection between behavioral data and checkout outcomes is where optimization happens. When you can watch the exact session behind an abandoned checkout, see where the shopper hesitated, and identify what to fix first based on revenue impact—that’s when benchmarks become actionable.
See exactly where your shoppers drop off and why.
FAQs about Checkout Conversion Benchmarks
Is a 25% checkout conversion rate good for ecommerce?
A 25% checkout conversion rate is below the typical benchmark of 40%+ for checkout completion, suggesting room for improvement. However, context matters—compare against your specific industry and device mix before drawing conclusions.
Is a 10% checkout conversion rate good for online stores?
A 10% checkout conversion rate indicates significant friction in your checkout flow. Most stores with optimized checkouts achieve 40-50% completion rates, so a 10% rate warrants immediate diagnostic attention.
What is the difference between checkout conversion rate and cart conversion rate?
Checkout conversion rate measures shoppers who start checkout and complete purchase. Cart conversion rate measures shoppers who view their cart and proceed to checkout. They represent different funnel stages—cart conversion happens earlier, checkout conversion happens at the final step.
How often should ecommerce stores review checkout conversion benchmarks?
Review your checkout conversion rate weekly to spot trends, and re-benchmark against industry data quarterly. Also review immediately after making checkout changes to measure impact.
Do checkout conversion rates vary by shopping season?
Yes, checkout conversion typically increases during major shopping events like Black Friday when shoppers arrive with higher purchase intent. Off-peak periods often see lower conversion as more visitors browse without immediate buying plans.

Hien Tran
I’m Hien Tran, a Product Marketing Executive at MIDA, specializing in eCommerce growth and conversion optimization. I focus on bridging product capabilities with real merchant needs—turning insights from heatmaps, session replays, and funnel analytics into actionable strategies that drive measurable results.


