How to Calculate and Reduce Your Checkout Abandonment Rate
A shopper adds items to their cart, clicks checkout, enters their email—and then disappears. That moment represents one of the most expensive leaks in your store: checkout abandonment.
This guide covers how to calculate your checkout abandonment rate, what benchmarks actually mean for your store, and the specific strategies that turn abandoned checkouts into completed orders.
What is checkout abandonment rate
Checkout abandonment rate measures the percentage of shoppers who start the checkout process but leave without completing their purchase. Average rates typically hover around 70% to 75% across ecommerce, though this varies by industry and checkout complexity.
Think of it like a customer at a physical register who loads items onto the counter, then walks away before paying. They showed clear purchase intent, but something stopped them at the final moment.
This metric specifically captures friction at the most critical conversion point. A shopper who reaches checkout has already browsed, evaluated, and decided to buy. When they leave at this stage, you’re losing someone who was genuinely ready to purchase.
Cart abandonment vs checkout abandonment
These two terms often get used interchangeably, but they measure different behaviors. Cart abandonment happens when a shopper adds items to their cart but never initiates checkout. Checkout abandonment occurs after they’ve clicked “checkout” and started entering their information.
The distinction matters because the causes and fixes differ for each.
| Metric | When it happens | What it measures |
|---|---|---|
| Cart abandonment | Items added, checkout not started | Interest without commitment |
| Checkout abandonment | Checkout started, purchase not completed | Intent lost at final stage |
Checkout abandonment signals a higher-intent shopper dropping off. Someone who abandoned their cart might have been casually browsing. Someone who abandoned checkout was ready to buy—until something got in the way.
How to calculate checkout abandonment rate
The formula is straightforward:
Checkout Abandonment Rate = [1 – (Completed Purchases ÷ Initiated Checkouts)] × 100
Here’s an example: 500 shoppers started checkout last week, and 150 completed their purchase. Your calculation would be [1 – (150 ÷ 500)] × 100 = 70%.
In Shopify, you can find initiated checkouts and completed purchases in your Analytics section under checkout reports. Third-party analytics tools often provide more granular breakdowns by device, traffic source, or specific checkout step.
One limitation worth noting: the formula tells you what happened but not why. A 70% rate doesn’t reveal whether shoppers left because of shipping costs, a confusing form, or a technical error. Behavioral tools like session replays fill that gap by showing the context behind the number.
Average checkout abandonment rate benchmarks
Checkout abandonment rates vary significantly by industry, device type, and checkout complexity. Finance and travel sectors often see higher rates due to complex purchase decisions, while simpler retail purchases typically show lower abandonment.
Mobile checkout abandonment tends to run higher than desktop—often by 10 to 15 percentage points. Smaller screens, harder-to-complete forms, and slower connections all contribute to this gap.
Your own trend over time matters more than hitting an industry average. If your rate dropped from 75% to 65% after simplifying your checkout, that’s meaningful progress regardless of what other stores experience.
Why checkout abandonment rate matters for your store
Every abandoned checkout represents lost revenue from a shopper who demonstrated clear purchase intent. These aren’t casual browsers—they’re people who selected products, clicked checkout, and started the buying process.
- Revenue recovery opportunity: Abandoned checkouts are warm leads. A well-timed recovery email can bring back a meaningful percentage of shoppers who left.
- UX problem indicator: High rates often point to fixable checkout issues like confusing forms, missing payment options, or trust concerns.
- Prioritization signal: Checkout abandonment rate tells you where optimization efforts will have the highest ROI, since fixing checkout friction directly impacts completed orders.
Common checkout abandonment reasons
Understanding why shoppers leave checkout helps you prioritize which fixes will have the biggest impact on your conversion rate.
Unexpected shipping costs and fees
Surprise costs at checkout erode trust instantly. A shopper sees a $50 product, mentally commits to that price, then discovers $12 shipping plus tax at the final step. That gap between expected and actual cost creates friction.
In session replays, this behavior looks like a shopper reaching the payment step, pausing when the total appears, then navigating away or closing the tab entirely.
Complex or lengthy checkout process
Too many form fields, confusing layouts, or multiple pages all add friction. Each additional step gives shoppers another opportunity to reconsider or get distracted.
Watch for behavioral signals like repeated tabbing between fields, rage clicks on unclear buttons, or shoppers scrolling up and down looking for something they can’t find.
Mandatory account creation
Forcing first-time buyers to create an account before purchasing adds an unnecessary barrier. Many shoppers want to complete their purchase quickly—not commit to a relationship with your brand before they’ve even received their first order.
Limited payment options
When shoppers don’t see their preferred payment method, they often leave rather than enter different payment details. This is especially true for options like Shop Pay, PayPal, or buy-now-pay-later services.
The behavioral pattern here is distinctive: a shopper scrolls through payment options, pauses, then exits without selecting anything.
Lack of trust signals
Missing security badges, unclear return policies, or an unfamiliar checkout design can make shoppers hesitate—particularly first-time visitors who don’t yet trust your brand. The more you’re asking someone to spend, the more reassurance they want before entering payment information.
Slow page load and performance issues
Checkout pages that load slowly or display errors cause immediate abandonment. Shoppers interpret technical problems as a sign that something might go wrong with their order or payment.
Look for error clicks, page refreshes, and form resubmissions in your session data. These signals indicate performance issues that are actively costing you sales.
How to diagnose checkout abandonment in your store
Calculating your rate tells you there’s a problem. Diagnosing shows you exactly where and why shoppers are leaving.
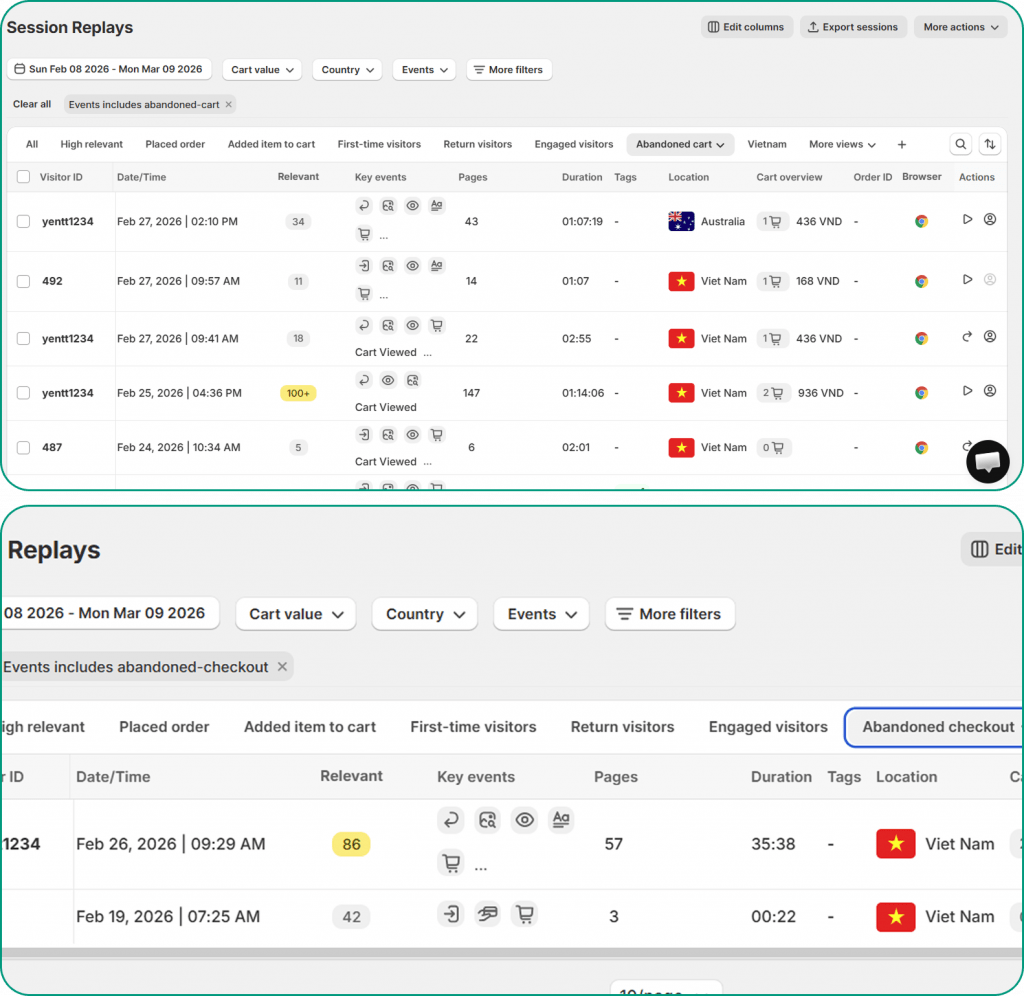
Session replays
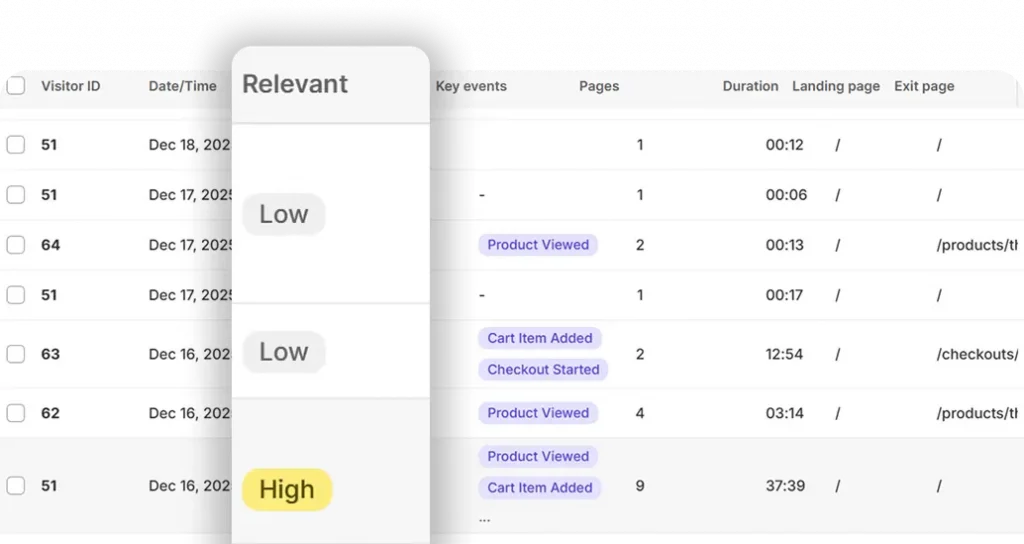
Session replays let you watch real checkout sessions to see hesitation, confusion, or exits as they happen. You can filter specifically for abandoned checkout sessions to focus on the moments that matter most.
MIDA’s order-linked recordings let you jump directly to the session behind any abandoned checkout, so you’re not hunting through hundreds of recordings to find relevant examples.
Heatmaps and click analysis
Heatmaps reveal which checkout elements get attention and which are ignored. Rage clicks—rapid, frustrated clicking on the same element—often indicate buttons that don’t work as expected or confusing interface elements.
Dead clicks on non-interactive elements suggest shoppers expect functionality that isn’t there. Both patterns point to specific UX issues you can fix.
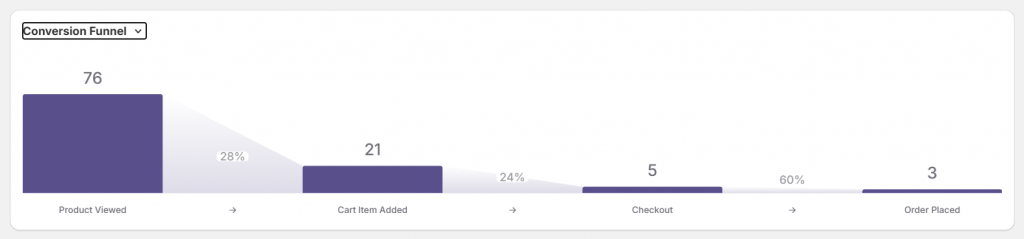
Checkout funnel visualization
Funnel analytics show exactly which checkout step loses the most shoppers. If 80% of abandonment happens at the shipping information step, that’s where you focus first.
MIDA’s order funnel visualization shows drop-offs from product view through checkout completion, helping you prioritize fixes based on where the biggest leaks occur.
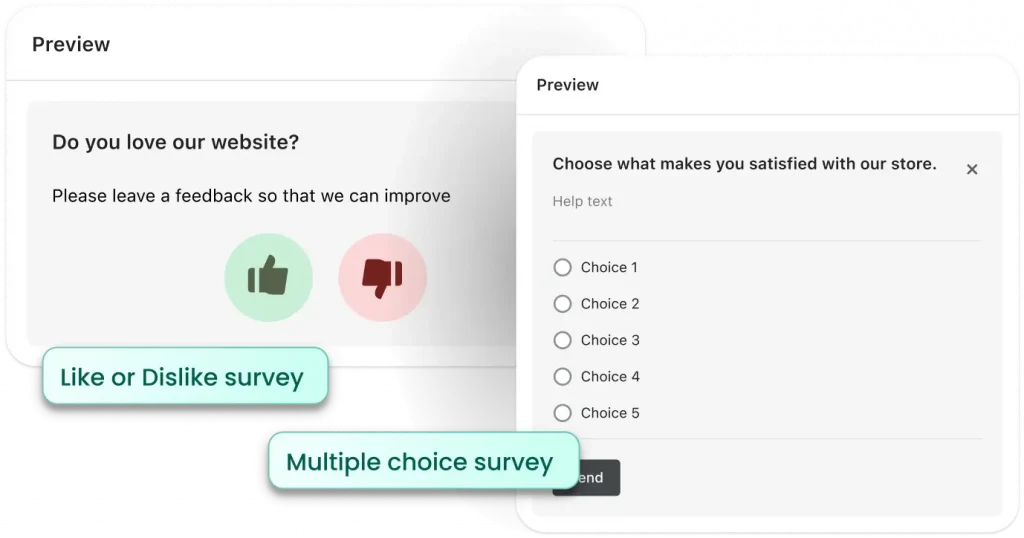
On-site surveys
Sometimes the fastest way to understand why shoppers leave is to ask them directly. Exit-intent surveys can capture feedback at the moment of abandonment with a simple question like “What stopped you from completing your purchase?”
When survey responses connect to session recordings, you get the complete picture: what shoppers said and what they did.
Strategies to reduce your checkout abandonment rate
The tactics below address the common causes covered earlier. Prioritize based on the specific issues you’ve identified in your own store.
1. Simplify your checkout flow
Reduce form fields to essentials and use autofill wherever possible. Single-page checkout often outperforms multi-step flows because it gives shoppers fewer opportunities to abandon.
2. Display total costs early
Show shipping, taxes, and fees on product or cart pages before checkout begins. When shoppers know the full cost upfront, they’re less likely to experience sticker shock at the payment step.
3. Offer guest checkout
Allow purchases without account creation, then offer account creation after the order is complete. You can still capture email addresses for order updates and future marketing without forcing a full account setup.
4. Add multiple payment options
Include popular options like Shop Pay, Apple Pay, PayPal, and buy-now-pay-later services. Each missing payment method represents a segment of shoppers who might leave rather than use an alternative.
5. Display trust signals throughout checkout
Add security badges, clear return policies, and customer reviews near the payment section. For first-time visitors especially, trust signals can make the difference between completing a purchase and abandoning.
6. Optimize checkout for mobile
Ensure buttons are tap-friendly, forms are minimal, and pages load quickly on mobile devices. Given that mobile abandonment rates run higher than desktop, mobile optimization often delivers outsized returns.
7. Implement exit-intent recovery
Exit-intent popups can offer help, discounts, or reminders when a shopper moves to leave checkout. Keep the offer relevant and the design clean.
8. Send abandoned checkout recovery emails
Automated follow-up emails to shoppers who left checkout with items in their cart can recover a meaningful percentage of otherwise lost sales.
Stop guessing why customers abandon checkout
Calculating your checkout abandonment rate is the first step. Understanding the behavior behind that number is what drives real improvement.
When you combine rate data with session replays, heatmaps, and survey feedback, you stop guessing and start seeing exactly where shoppers get stuck and why they leave. MIDA gives Shopify merchants visibility into real shopper journeys, checkout friction, and the exact moments that block revenue.
FAQs about checkout abandonment rate
What is a good checkout abandonment rate for ecommerce stores?
A “good” rate depends on your industry and checkout complexity, but rates below your industry’s average indicate a smoother checkout experience. Rather than chasing a specific number, focus on improving your own rate over time. A 10-point reduction in your abandonment rate translates directly to more completed orders.
How often should you monitor your checkout abandonment rate?
Weekly monitoring works well for most stores to track trends and spot anomalies. During critical periods like major sales events, site redesigns, or new checkout implementations, check more frequently to catch issues before they impact significant revenue.
Does checkout abandonment rate differ by traffic source?
Yes. Shoppers from different traffic sources often show different abandonment patterns based on their intent and expectations. Paid social traffic might abandon more frequently than email subscribers who already know your brand. Segmenting your checkout data by source helps identify which channels bring higher-converting traffic.
Can slow checkout page speed cause higher abandon rates?
Slow-loading checkout pages frustrate shoppers and increase the likelihood they’ll leave before completing their purchase. Even a few extra seconds of load time can measurably impact abandonment. Optimizing page speed is one of the simplest ways to reduce checkout abandonment.


