What Is Cart Abandonment Rate? Industry Averages Explained
Cart abandonment rate is the percentage of shoppers who add items to their cart but leave your store without completing a purchase. For most ecommerce stores, that number hovers around 70%—meaning seven out of ten shopping carts never convert to orders.
This guide covers how to calculate your rate, what benchmarks actually matter for your industry and device mix, the most common reasons shoppers abandon, and how to diagnose the specific friction points costing your store revenue.
What is cart abandonment rate
Cart abandonment rate measures the percentage of shoppers who add items to their cart but leave without completing a purchase. The average sits around 70%, which means most online shopping carts never convert to orders. The main drivers include unexpected costs like shipping and taxes, complicated checkout processes, and forced account creation—particularly on mobile, where abandonment runs even higher.
Picture a customer in a physical store who fills a basket, walks toward the register, then sets everything down and leaves. That’s cart abandonment. Every abandoned cart represents a shopper who showed purchase intent but hit something that stopped them.
The metric quantifies lost opportunity. Knowing your rate—and more importantly, why it’s happening—gives you a starting point for recovering revenue that’s already within reach.
Cart abandonment vs checkout abandonment
These two terms get used interchangeably, but they measure different behaviors. Knowing which one you’re dealing with changes where you look for problems.
What is cart abandonment
Cart abandonment happens when a shopper adds products to their cart but never starts the checkout process. They browsed, liked something enough to add it, but didn’t take the next step.
This often signals issues earlier in the journey—price concerns, comparison shopping, or browsing without real purchase intent. The friction occurs before they’ve committed to buying.
What is checkout abandonment
Checkout abandonment is more specific. The shopper actually begins checkout—they’ve clicked through to enter their information—but they don’t complete the purchase.
This behavior indicates stronger purchase intent that something interrupted. The problem usually lives within the checkout flow itself: unexpected costs appearing, confusing forms, or trust concerns at the payment step.
Why the distinction matters
Each type calls for a different diagnostic approach. High cart abandonment might point to product page clarity, pricing transparency, or shoppers using carts as wishlists. High checkout abandonment points to form fields, payment options, and trust signals.
Treating them as the same problem leads to fixing the wrong things.
How to calculate cart abandonment rate
Cart abandonment rate formula
The calculation is straightforward:
Cart Abandonment Rate = (1 − [Completed Purchases] ÷ [Carts Created]) × 100
- Completed Purchases: Total orders placed during your measurement period
- Carts Created: Total shopping carts initiated during that same period
Example calculation
Say your store had 500 carts created last month and 150 completed purchases. Divide 150 by 500 to get 0.30, subtract that from 1 to get 0.70, then multiply by 100.
Your cart abandonment rate: 70%.
This gives you a baseline. The real value comes from tracking this number over time and segmenting it by device, traffic source, and customer type to spot patterns.
Average cart abandonment rate benchmarks
Knowing your rate is useful. Knowing how it compares to relevant benchmarks is more useful. Context helps you understand whether you’re facing a normal ecommerce reality or a fixable problem.
Overall ecommerce cart abandonment statistics
Research from the Baymard Institute puts the average cart abandonment rate around 70%. This isn’t a crisis—it’s a baseline reality of online shopping.
Many shoppers use carts for comparison shopping, price checking, or saving items for later. Not every abandoned cart represents a lost sale that was yours to win.
Shopping cart abandonment rate by device
Mobile shoppers abandon carts at significantly higher rates than desktop users. The gap exists because mobile checkout involves more friction: smaller screens, harder form entry, and more distractions.
| Device | Typical Abandonment Rate | Primary Friction |
|---|---|---|
| Desktop | Lower (~70%) | Fewer barriers, easier forms |
| Mobile | Higher (~84%) | Small screens, difficult typing |
| Tablet | Middle ground (~75%) | Falls between the two |
If your mobile traffic is growing but conversions aren’t keeping pace, device-specific abandonment is worth investigating.
Online shopping cart abandonment rate by industry
Abandonment rates vary significantly by what you sell. Complex, high-consideration purchases see higher abandonment than routine, necessity-driven ones.
| Industry | Relative Rate | Why |
|---|---|---|
| Travel | Highest | Complex booking, heavy comparison shopping |
| Fashion | Above average | Sizing uncertainty, browsing behavior |
| Electronics | Average | Price comparison across retailers |
| Pet supplies | Below average | Repeat purchases, brand loyalty |
| Groceries | Lowest | Necessity purchases, routine buying |
Your own historical data matters more than industry averages. A 5% increase in your abandonment rate signals something changed—regardless of where you sit relative to competitors.
Why shoppers abandon their carts
Understanding the common causes helps you prioritize where to look for problems in your own store.
Unexpected shipping costs and fees
This is consistently the top reason shoppers abandon. They’ve mentally committed to a price, then discover additional costs at checkout that change the equation.
The experience feels like a bait-and-switch. A shopper adds a $40 item, proceeds to checkout, sees $12 shipping appear for the first time, and closes the tab.
Complicated or lengthy checkout process
Too many form fields, multiple pages, or required information that seems unnecessary all create friction. Each additional step is an opportunity for the shopper to reconsider.
Behavioral signals of this issue include rage clicks on form fields (rapid, repeated clicking out of frustration), repeated typing errors, or long pauses between steps.
Lack of trust signals
First-time visitors to unfamiliar stores are naturally skeptical. They’re looking for reassurance that the store is legitimate and their payment information will be secure.
Missing trust signals—security badges, recognizable payment logos, clear return policies—create hesitation. Hesitation at the payment step often becomes abandonment.
Forced account creation
Requiring shoppers to create an account before purchasing adds friction at exactly the wrong moment. They want to complete a transaction, not commit to a relationship.
Guest checkout removes this barrier. You can always offer account creation after the purchase, once trust is established.
Poor mobile shopping experience
Given the higher mobile abandonment rates, this deserves specific attention. Small tap targets, hard-to-read forms, and layouts that require pinching and zooming all compound on mobile devices.
Watch for behavioral signals like excessive zooming, missed taps, or rapid back-and-forth scrolling—these indicate the mobile experience is fighting against the shopper.
Slow page load times
Every second of delay increases abandonment. Shoppers are impatient, particularly on mobile, and a slow-loading cart or checkout page signals an unreliable experience.
How to diagnose cart abandonment problems
Knowing the common causes is a starting point. Finding the specific causes in your store requires looking at actual shopper behavior.
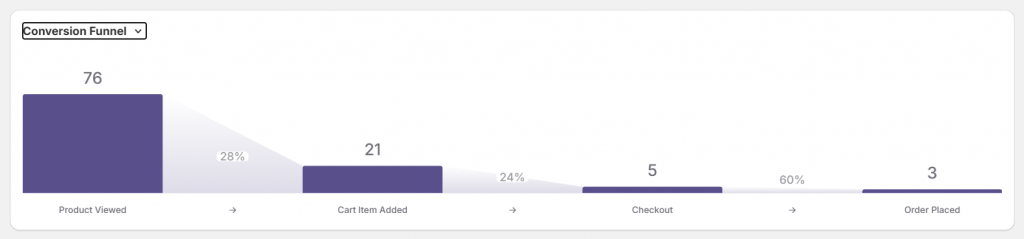
Analyze your checkout funnel drop-off points
Funnel visualization shows exactly where shoppers exit between key steps: product view → add to cart → checkout initiated → purchase complete.
This analysis reveals which step has the problem. A big drop between “add to cart” and “checkout initiated” suggests different issues than a drop between “payment info” and “purchase complete.”
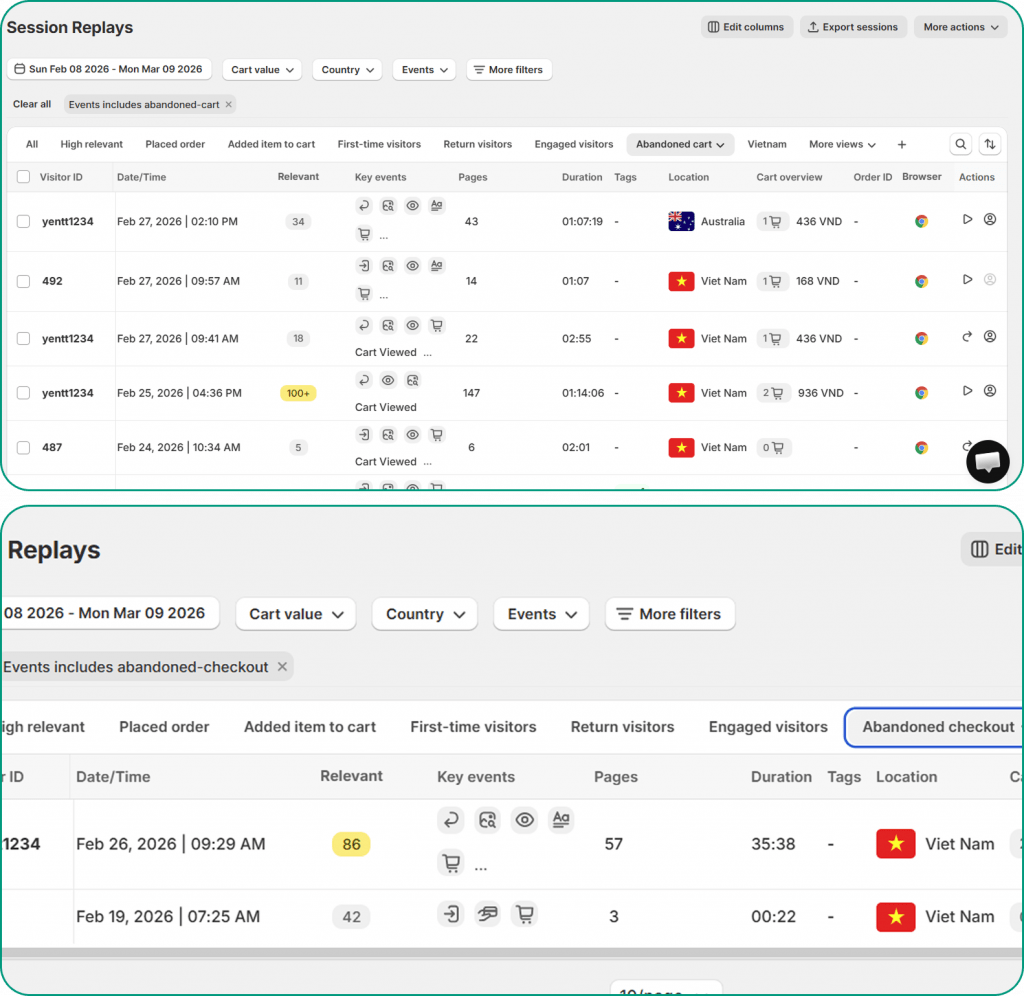
Watch session replays of abandoned carts
Session recordings let you watch real shopper behavior leading up to abandonment. You see where they paused, what they clicked, where they seemed confused, and the exact moment they left.
Tools like MIDA let you filter recordings to show only abandoned cart sessions, so you’re watching the behavior that matters most. Look for hesitation patterns, rage clicks on unresponsive elements, or repeated scrolling that suggests they’re searching for something.
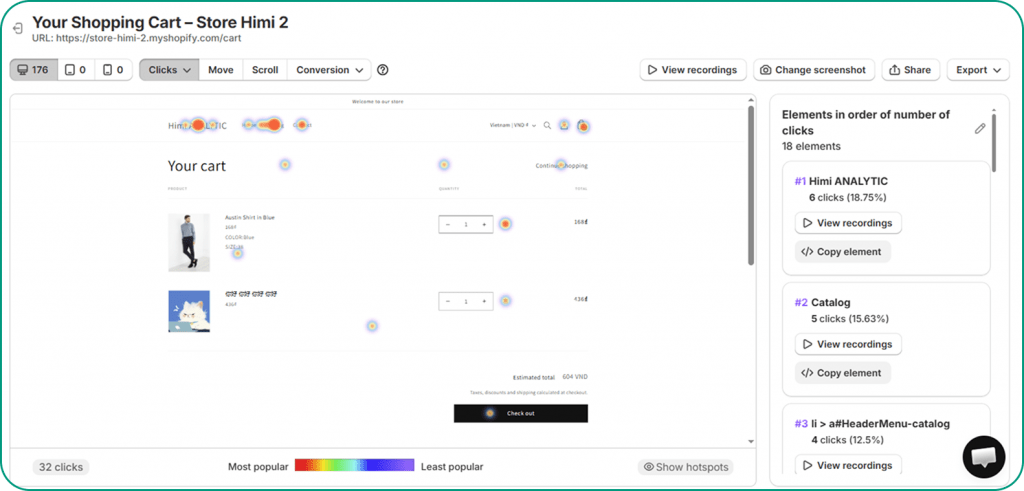
Review heatmaps on cart and checkout pages
Heatmaps aggregate behavior across many visitors to show patterns. Click maps reveal where shoppers are clicking—including dead clicks on non-clickable elements. Scroll maps show how far down the page visitors actually go.
If your shipping information sits below where most shoppers scroll, they might be abandoning because they never saw it. Heatmaps surface these visibility problems.
Use on-site surveys to capture shopper feedback
Sometimes the fastest path to understanding is asking directly. Exit-intent surveys can capture reasons that behavioral data can’t reveal:
- “I couldn’t find my preferred payment method”
- “I wasn’t sure about the return policy”
- “Shipping cost was higher than expected”
When survey responses connect to session recordings, you get the complete picture—what shoppers said and what they actually did.
Strategies to reduce your cart abandonment rate
The tactics below address the most common abandonment causes. Prioritize based on what your diagnostic work reveals rather than implementing everything at once.
1. Show total costs before checkout
Display shipping estimates on product pages or within the cart itself. When shoppers know the full cost before they reach checkout, the final total isn’t a surprise.
Eliminating cost surprises at the payment step directly addresses the top abandonment reason.
2. Streamline checkout to fewer steps
Reduce form fields to only what’s essential. A single-page checkout often outperforms multi-step processes. Use autofill, address validation, and smart defaults to minimize typing.
3. Enable guest checkout
Allow purchases without account creation. The option to create an account can come after the purchase, when the shopper has already demonstrated trust by completing a transaction.
4. Display trust badges and security indicators
Place SSL indicators, payment provider logos, and guarantee badges prominently—especially near the payment button where doubt is highest.
Clear return policies and contact information also build confidence for first-time buyers.
5. Optimize cart and checkout for mobile
Ensure large tap targets, minimal required typing, and support for mobile-friendly payment options like Apple Pay or Shop Pay. Test on actual devices, not just browser preview modes.
Given the mobile abandonment gap, improvements here often yield significant results.
6. Trigger exit-intent popups or abandoned cart emails
Exit-intent popups can capture shoppers before they leave with a relevant offer. Abandoned cart emails bring them back after they’ve gone.
The key is timing and relevance—create urgency without pressure.
How to turn cart abandonment insights into revenue
Understanding why shoppers abandon is the first step. The value comes from connecting that understanding to specific, prioritized actions.
Behavioral analytics tools like MIDA connect the dots between what happened on the page and the revenue outcome. You can watch the exact session behind an abandoned cart, see where the shopper hesitated, and identify what to fix first based on revenue impact.
See exactly where your shoppers drop off and why.
Frequently asked questions about cart abandonment rate
What is a good cart abandonment rate?
A “good” rate depends on your industry, device mix, and traffic sources. Rather than chasing a universal target, focus on whether your rate is improving over time and how it compares to stores similar to yours. A fashion store at 72% might be performing well; the same rate for a grocery store would signal problems.
How often should you monitor your cart abandonment rate?
Weekly monitoring catches trends early without creating noise from daily fluctuations. Dig deeper into session-level data whenever you notice unexpected spikes or after implementing checkout changes.
Can you recover revenue from abandoned carts?
Yes. Abandoned cart email sequences, retargeting ads, and exit-intent offers all bring shoppers back to complete purchases. Recovery rates vary, but even modest improvements represent meaningful revenue when applied to the volume of abandoned carts most stores see.
What is the difference between abandonment rate and bounce rate?
Bounce rate measures visitors who leave after viewing only one page without any interaction. Cart abandonment rate specifically tracks shoppers who added items but didn’t purchase. They measure different stages of the journey—bounce rate is about initial engagement, abandonment rate is about purchase completion.


