Best Shopify Heatmap Apps: 12 Tools Tested for Performance in 2026
Your Shopify store gets traffic, but visitors leave without buying. If your bounce rate is above average for Shopify stores, you need to understand not just that customers are leaving, but exactly where and why they abandon your store. Heatmap apps show you exactly where customers click, how far they scroll, and which elements they ignore, transforming guesswork into visual evidence you can act on.
This guide evaluates 12 heatmap tools tested on real Shopify stores, comparing their features, pricing, and performance impact. You’ll learn which apps serve different store sizes and optimization goals, how to set up tracking properly, and what to look for when choosing between Shopify-specific tools and general analytics platforms.
>> You may also like:
- Heatmap Analysis: 10 Best Practices for Better Insights
- What Are Scroll Maps and How to Use Them for Better Conversions
- How to Fix Rage Clicks and Dead Clicks on Your Shopify Store in 2026
The Complete Conversion Optimization Stack: Where Heatmaps Fit
While heatmaps are crucial for understanding customer behavior, they’re most powerful when combined with other conversion optimization tools. The highest-performing Shopify stores use heatmaps alongside:
- Trust & Social Proof Apps (Yotpo, Judge.me) – Heatmaps show you where to place reviews and trust badges for maximum visibility
- Email & Cart Recovery Tools (Klaviyo, Privy) – Heatmaps optimize email signup placement and exit-intent popup timing
- Upsell & Cross-sell Apps (Rebuy, ReConvert) – Heatmaps reveal where customers look for related products and recommendations
- Page Builder Tools (PageFly, Shogun) – Heatmaps inform landing page layout and CTA placement decisions
This guide focuses specifically on the heatmap layer of your optimization stack, but understanding how it connects to other tools ensures you’re building a complete conversion system rather than just collecting data.
What Are Heatmap Analytics Tools for Shopify?
Heatmap analytics tools are visual tracking software that show where visitors click, scroll, and interact on your Shopify store using color-coded overlays. Red and orange zones indicate high activity, while blue and green show areas customers ignore. Think of it like a thermal camera for your website—instead of guessing which elements attract attention, you see exactly where customers focus their eyes and fingers.
Unlike Google Analytics, which tells you 200 people visited your product page, heatmaps reveal that 180 of them never scrolled past the first image. Or that your “Add to Cart” button gets fewer clicks than a decorative element nearby. The difference matters because knowing what happened doesn’t help you fix why it happened.
Most heatmap tools integrate directly with Shopify through apps in the App Store. Once installed, they begin tracking real customer behavior without requiring coding knowledge or technical setup.
Why Every Shopify Store Needs Heatmap Data?
Traditional analytics platforms show outcomes like bounce rates and conversion percentages, but they don’t explain the reasoning behind those numbers. You know 65% of customers abandon at checkout, but you don’t know if they’re confused by a form field, surprised by shipping costs, or clicking a broken element.
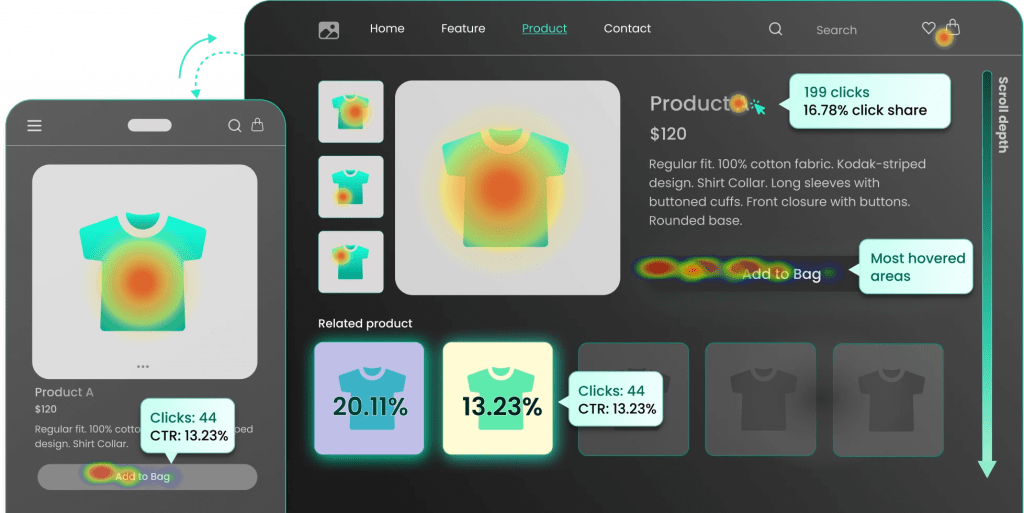
Discover Where Customers Actually Click
Click heatmaps expose the truth about which elements attract customer attention versus which get ignored entirely. You might discover that customers repeatedly click on product images expecting a zoom function that doesn’t exist. Or that a non-clickable heading draws more attention than your primary call-to-action button.
The data frequently reveals “false bottoms” where customers assume the page has ended because of poor visual hierarchy. Distracting elements—decorative graphics, secondary links, or poorly placed badges—often pull clicks away from your Add to Cart button.
See How Far Visitors Scroll on Product Pages
Scroll heatmaps display the percentage of visitors who reach each section of your page. Typically, 90% of customers see your hero image but only 40% make it to your product reviews. If your most compelling product details sit below the fold where only 30% of visitors scroll, you’re hiding your best sales copy from 70% of potential customers.
The data removes mystery about content placement. You stop guessing where to put trust badges, shipping information, and social proof, and start placing them where customers actually look.
Reduce Cart Abandonment with Visual Insights
Heatmaps combined with session recordings reveal the exact moments customers hesitate, re-read form fields, or abandon your checkout process. You might find that customers repeatedly click between your cart and product pages because shipping costs aren’t displayed early enough. Or that they hover over a form field for 20 seconds trying to understand what information you’re requesting.
While analytics tell you that 65% of customers abandon at checkout, heatmaps show you that they’re all clicking on a trust badge that leads nowhere. Or that mobile users can’t easily tap the “Complete Order” button because it’s too small.
Make Data-Driven Design Decisions
Heatmap data transforms optimization from subjective debate into objective analysis. Instead of arguing about design preferences, you watch actual customer behavior and see which placement generates more engagement and which design causes confusion.
This evidence-based approach prevents costly redesigns based on personal preferences or trends that don’t match your customer behavior. You validate or invalidate hypotheses quickly, then invest resources in changes that actually move the needle.
Types of Shopify Heatmaps You Should Track
Different heatmap types answer different questions about customer behavior. Most Shopify stores benefit from tracking multiple types simultaneously because each one reveals a distinct pattern in how customers interact with your store.
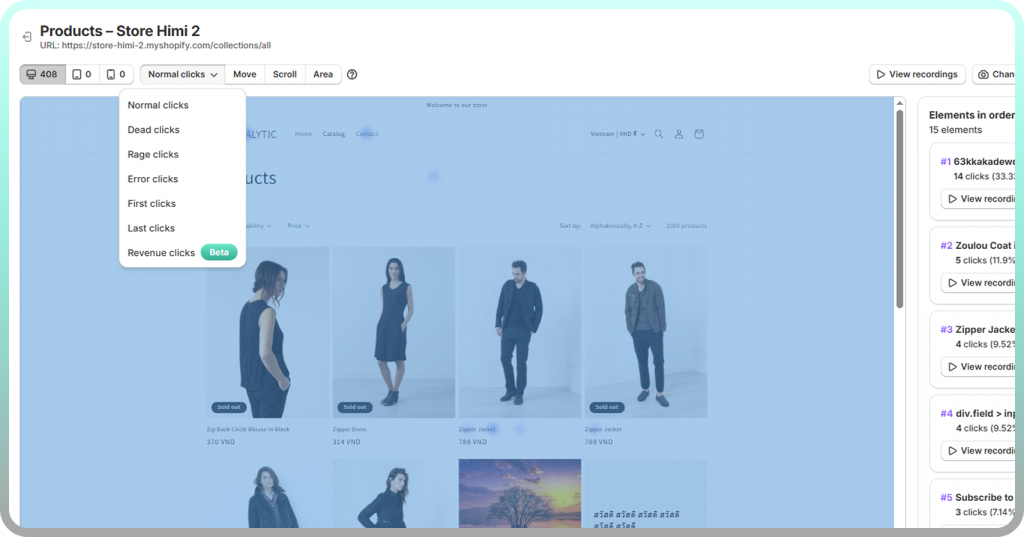
Click Tracking Heatmaps
Click heatmaps visualize every tap and click on your store, with warmer colors marking high-activity zones and cooler colors showing ignored areas. They’re particularly useful for testing CTA placement, identifying broken links that customers try to click, and discovering distracting elements that steal attention from conversion-critical buttons.
On mobile devices, click heatmaps reveal whether buttons are large enough to tap accurately or if customers accidentally click adjacent elements. They also expose rage clicks—repeated frustrated taps on elements that don’t respond—which signal major UX problems that traditional analytics completely miss.

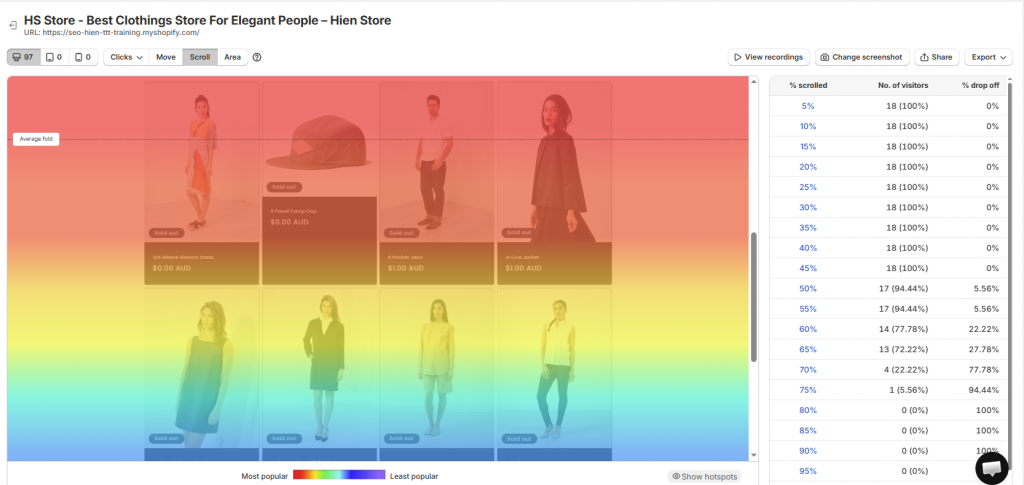
Scroll Depth Heatmaps
Scroll heatmaps display how far down each page visitors scroll before leaving, typically shown as percentage bands or color gradients that fade from red at the top to blue at the bottom. The data answers critical questions about content length: are you losing customers before they see your key product benefits, or are you forcing them to scroll through unnecessary content to reach the Add to Cart button?
Most Shopify stores discover that mobile users scroll less than desktop visitors. Your mobile layout needs different content prioritization because what works on desktop often fails on mobile.

Mouse Movement Heatmaps
Mouse movement heatmaps track cursor position as a proxy for visual attention, based on eye-tracking research showing that people tend to look where they move their mouse. The data reveals which page sections draw natural attention versus which get skipped entirely.
However, mouse movement data is less reliable than click or scroll data since some users move their cursor randomly while reading. Look for patterns across many sessions rather than drawing conclusions from individual recordings.

Mobile Touch Heatmaps
Mobile touch heatmaps track taps, swipes, pinches, and other gestures specific to smartphone and tablet users. Given that most Shopify stores receive 60-80% of their traffic from mobile devices, mobile heatmaps often reveal your most critical UX issues.
They expose problems like tap targets that are too small, swipeable elements that don’t respond to gestures, or form fields that trigger the wrong keyboard type. Mobile touch data also shows whether customers try to zoom on product images, swipe through image galleries, or use gestures your store doesn’t support.
12 Best Heatmap Apps for Shopify We Tested
We evaluated each tool based on Shopify integration ease, site performance impact, feature depth for e-commerce optimization, pricing structure, and how well they serve Shopify merchants specifically versus general website analytics. The apps below are ordered by their overall value for Shopify stores, with particular emphasis on tools built specifically for e-commerce rather than adapted from generic web analytics platforms.
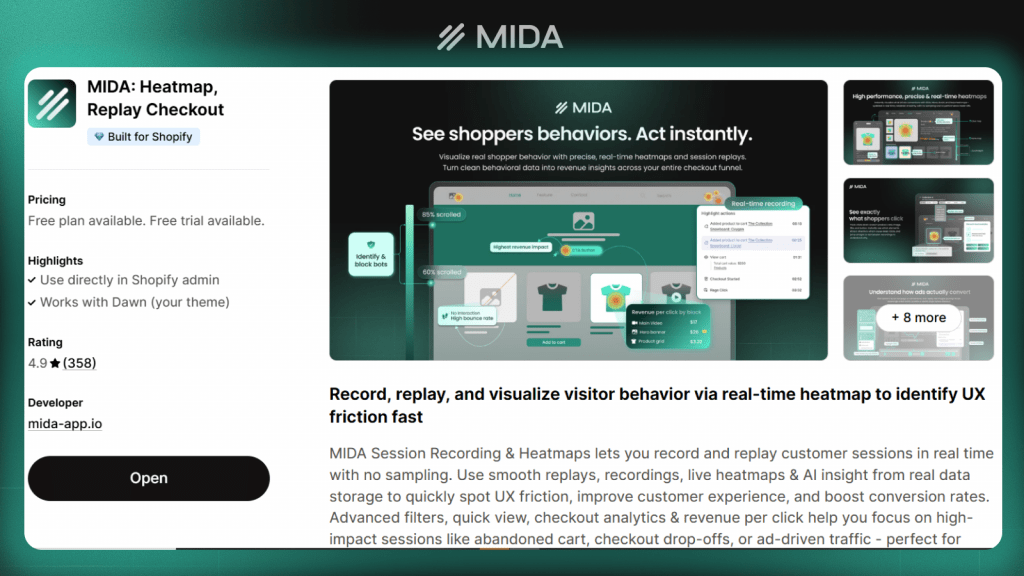
1. MIDA
MIDA is an all-in-one Shopify analytics platform built specifically to help merchants understand, optimize, and convert more customers, especially at checkout. MIDA combines visual behavior analytics, session recordings, checkout analytics, and on-site surveys into a single, Shopify-native tool.
Unlike generic website analytics adapted for eCommerce, MIDA integrates deeply with Shopify checkout events, checkout funnels, and revenue data, allowing merchants to see not just what customers do, but where and why revenue is lost during checkout—and how to fix it.
Key features:
- Click, scroll, move and area heatmaps with filtering by revenue, cart value, and checkout events
- Session recordings showing complete customer journeys from landing page through purchase or abandonment
- Checkout recordings that capture real customer behavior across Shopify checkout steps, revealing friction points, hesitations, and drop-offs
- Checkout funnel analytics to visualize where users abandon, compare step-by-step performance, and identify high-impact optimization opportunities
- On-site surveys that capture qualitative feedback at critical moments in the buyer journey
- Shopify-specific metrics linking visual behavior data directly to revenue and conversion performance
Best for: Shopify merchants who want clear visibility into checkout behavior, actionable checkout optimization insights, and a unified analytics platform without juggling multiple tools or stitching together disconnected data.
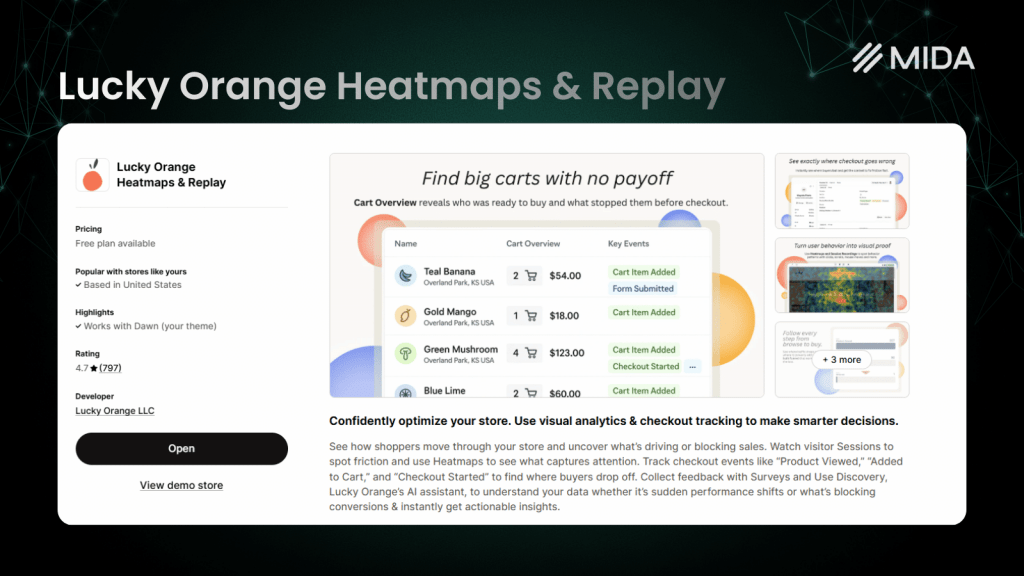
2. Lucky Orange
Lucky Orange offers real-time visitor tracking combined with dynamic heatmaps that update as customers browse your store. The platform includes built-in live chat, allowing you to proactively engage with visitors who show signs of confusion or hesitation based on their behavior patterns.
Best for: Stores that want to monitor visitor behavior in real-time and combine analytics with proactive customer support.
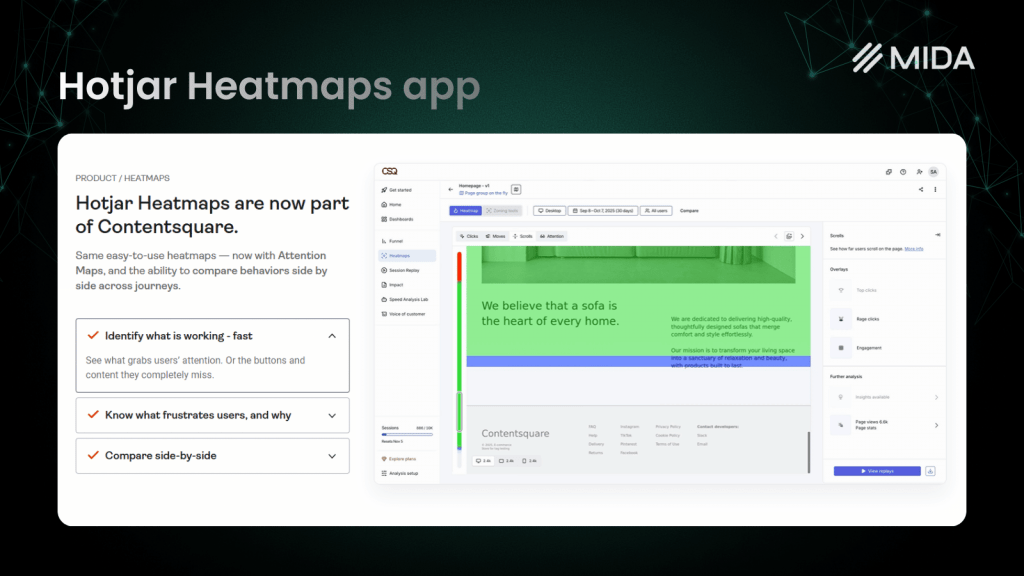
3. Hotjar
Hotjar is one of the most recognized names in website analytics, offering Shopify integration alongside its core platform used by millions of websites. The tool provides extensive documentation, a large user community, and a familiar interface for merchants who’ve used Hotjar on other platforms.
Best for: Merchants already familiar with Hotjar from previous experience or those who value brand recognition and established support resources.
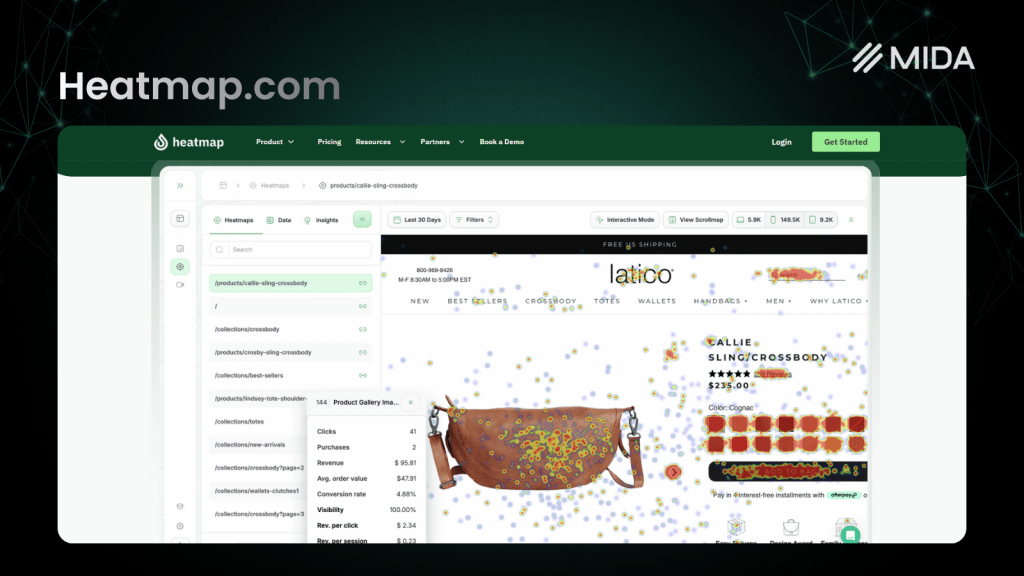
4. Heatmap.com
Heatmap.com emphasizes site performance, claiming zero impact on page load times through asynchronous tracking and lightweight code. The platform includes AI-powered insights that automatically identify patterns and suggest optimizations based on your heatmap data.
Best for: Speed-conscious merchants worried about analytics tools slowing down their store or impacting Core Web Vitals scores.
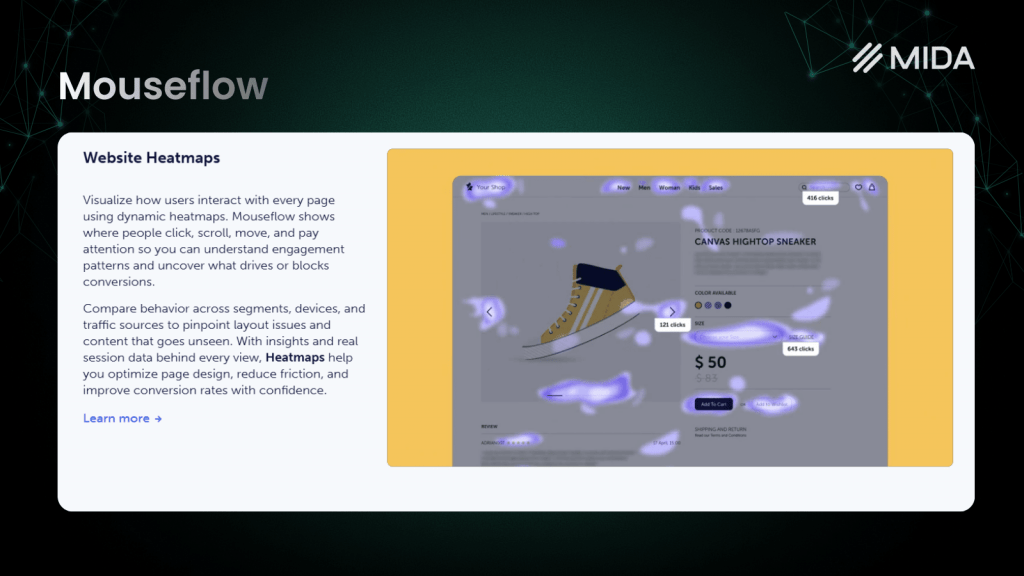
5. Mouseflow
Mouseflow provides comprehensive session replay and heatmap capabilities with advanced filtering that lets you segment by custom events, form interactions, and friction signals. The platform offers six different heatmap types, including attention heatmaps that combine multiple data sources to predict where users focus their attention.
Best for: Stores needing granular session filtering and detailed form optimization, particularly for complex checkout flows or multi-step processes.
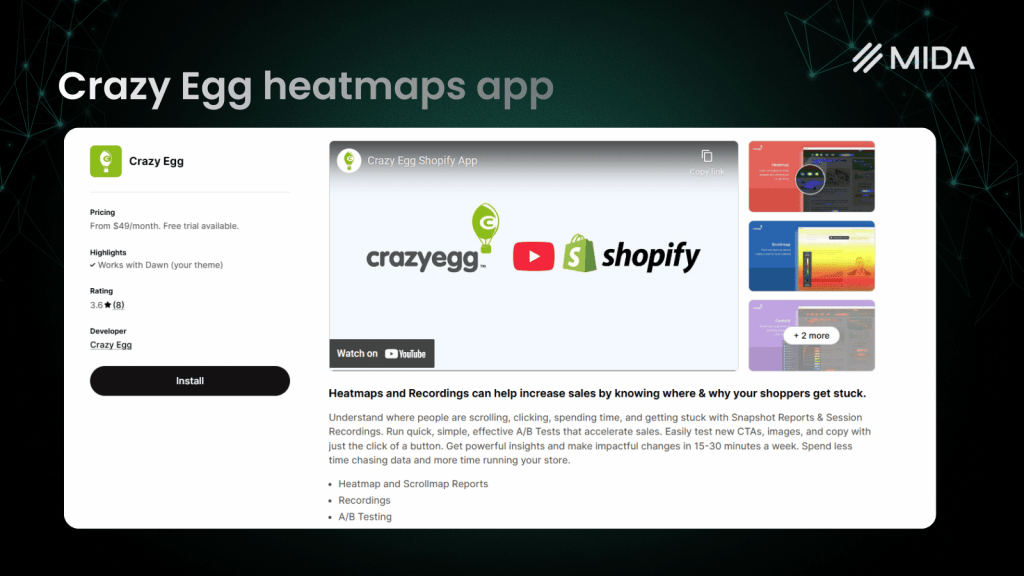
6. Crazy Egg
Crazy Egg pioneered commercial heatmap tools and maintains a reputation for simplicity and ease of use. The platform’s “Snapshots” feature creates comprehensive heatmap reports for any page, while its scrollmaps show exact drop-off percentages at every pixel depth.
Best for: Merchants wanting straightforward heatmap analysis without complexity or steep learning curves.
7. Smartlook
Smartlook tracks both web and mobile app analytics in a unified platform, making it valuable for brands with Shopify stores and companion mobile apps. The tool automatically tracks events without requiring manual setup, reducing implementation time and technical overhead.
Best for: Brands operating both Shopify web stores and mobile applications who want unified analytics across platforms.

8. FigPii
FigPii positions itself as a conversion rate optimization platform that tightly integrates heatmaps with A/B testing capabilities. Session replays can be filtered by test variant, allowing you to watch how customers interact with different versions of your pages.
Best for: Stores running active A/B testing programs who want to combine quantitative testing with qualitative behavior analysis.

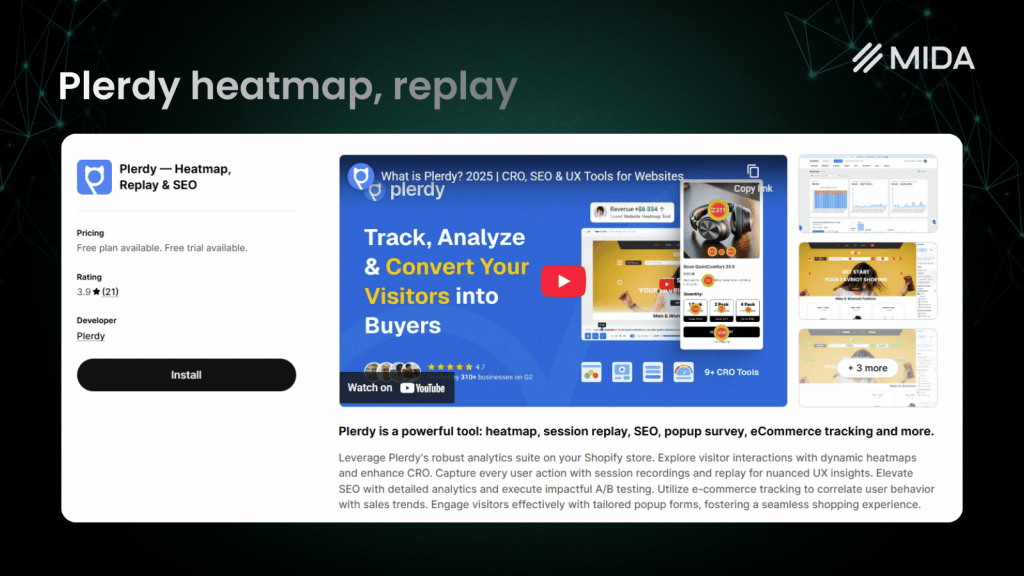
9. Plerdy
Plerdy combines heatmap analytics with SEO performance tracking, offering insights into how search traffic behaves differently than other sources. The platform includes e-commerce event tracking that connects heatmap data to product views, add-to-cart actions, and purchases.
Best for: Merchants optimizing simultaneously for SEO and conversion who want to understand how organic traffic interacts with their store.
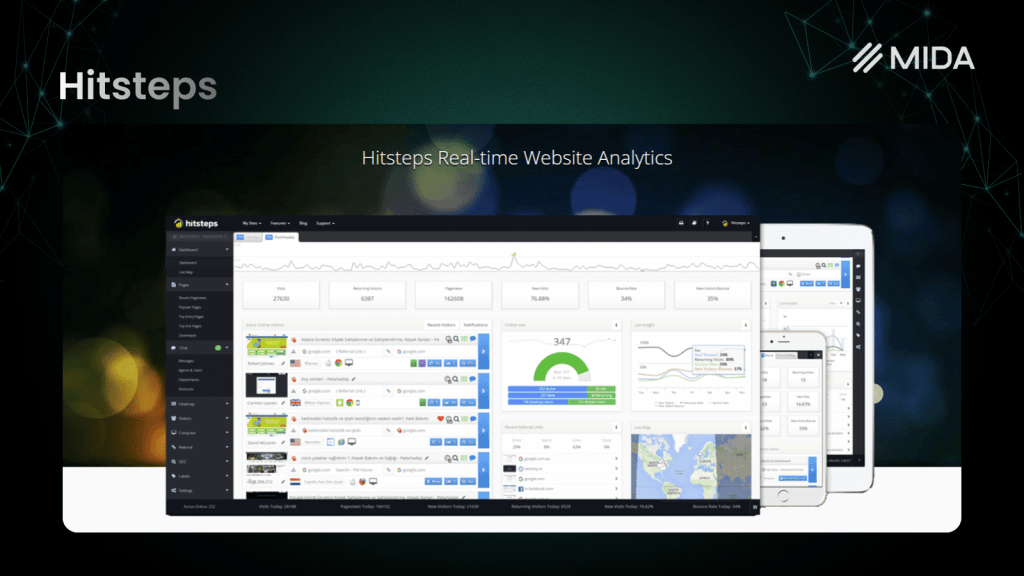
10. Hitsteps
Hitsteps is primarily a real-time analytics platform that includes heatmaps as one component alongside live visitor monitoring and uptime tracking. The dashboard shows current visitors, their location, and their activity as it happens.
Best for: Stores wanting a real-time analytics dashboard with heatmap capabilities as a secondary feature.
11. UXtweak
UXtweak focuses on comprehensive UX research, offering heatmaps alongside user testing, prototype testing, card sorting, and tree testing tools. The platform is more research-oriented than conversion-focused, making it valuable for brands conducting extensive customer experience studies.
Best for: Brands conducting comprehensive UX research beyond basic heatmap analysis, particularly when testing new designs or major redesigns.

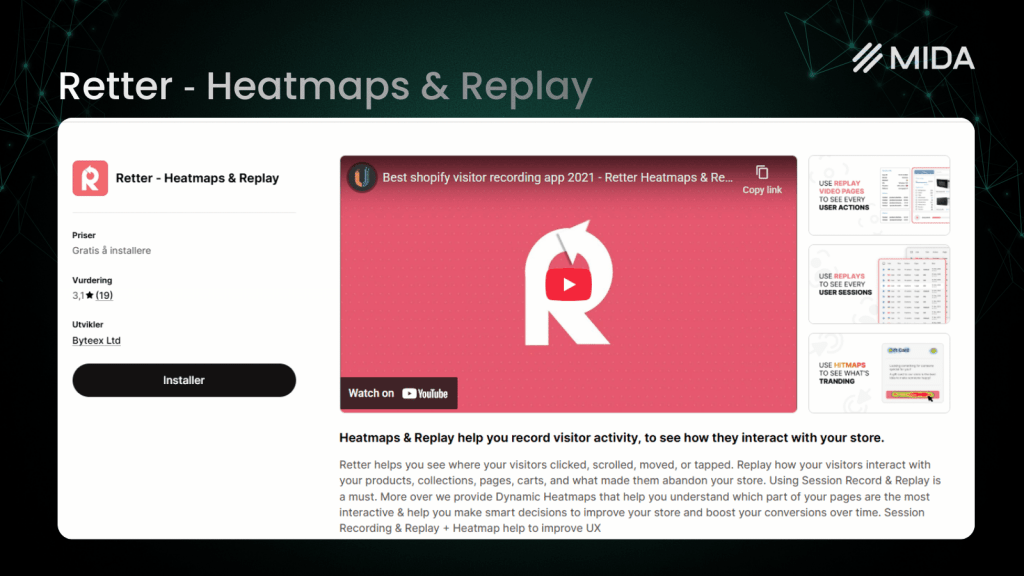
12. Retter Heatmap
Retter Heatmap is a lightweight, budget-friendly app built specifically for Shopify stores. The tool offers basic click and scroll heatmaps with simple session recordings, making it an accessible entry point for stores new to behavior analytics.
Best for: Small stores or merchants new to heatmaps wanting a simple, low-cost introduction to behavior analytics.
Heatmap Shopify App Pricing Comparison
| App | Free Tier | Starting Price | Mid-Tier | Free/Entry Limitation |
|---|---|---|---|---|
| MIDA | Yes | $9.9/month | $19.9/month | 250 sessions/month |
| Lucky Orange | 7-day trial | $19/month | $39/month | 100 sessions/month |
| Hotjar | Yes | $40/month | Talk to sales | Up to 200k monthly sessions |
| Heatmap.com | 14-day trial | $29/month | $149/month | Trial only |
| Mouseflow | Yes | $25/month | $109/month | 500 sessions/month |
| Crazy Egg | 30-day trial | $49/month | $99/month | 75,000 pageviews/month |
| Smartlook | Yes | $55/month | $119/month | 3,000 sessions/month |
| FigPii | Yes | $149.99/month | $299.99/month | 15,000 visitors/month |
| Plerdy | Yes | $29/month | $59/month | 2,000 pageviews/day |
| Hitsteps | Yes | $10/month | $29/month | below 2,000 pageviews/month |
| UXtweak | Yes | $99/month | $199/month | Limited tests |
| Retter Heatmap | Yes | $4.99/month | $9.99/month | 500 page views each month |
Most heatmap apps price based on monthly sessions or pageviews tracked, which means your costs scale with traffic volume. Shopify-specific apps often provide better value than general web analytics tools because they’re optimized for e-commerce tracking—they automatically capture checkout events, cart interactions, and revenue data without requiring custom implementation.
How to Set Up Heatmaps on Your Shopify Store
Most Shopify heatmap apps are designed to work out of the box. You don’t need technical knowledge, custom code, or complex setup flows. In most cases, the entire process takes under 2–3 minutes, and data starts flowing in real time.
Step 1: Choose a Heatmap App from the Shopify App Store
Try MIDA app for free to combine heatmaps, session recordings, and on-site surveys in one Shopify-optimized platform.
Choosing the Right Shopify Heatmap Tool for Your Store
The “best” heatmap app depends on your specific store needs, technical resources, and optimization goals rather than any universal ranking. Here’s what to consider when evaluating options:
- Store size and traffic volume: Match app pricing tiers to your monthly sessions to avoid overpaying for unused capacity or hitting limits that stop tracking mid-month
- Primary optimization goal: Choose apps with strong checkout tracking if you’re focused on cart abandonment, or robust product page heatmaps if you’re optimizing merchandising and content layout
- Technical resources: Shopify-native apps offer automatic setup and maintenance, while general analytics platforms may require custom implementation or ongoing technical support
- Budget constraints: All-in-one platforms like MIDA or Lucky Orange cost more upfront but eliminate the need for separate session recording and survey tools, potentially reducing total spend
- Integration needs: Verify compatibility with your existing analytics stack, A/B testing tools, or customer data platform to avoid creating data silos
Shopify-optimized tools generally outperform general web analytics platforms for e-commerce insights because they automatically track checkout events, cart interactions, and revenue attribution without custom configuration. However, if you’re already using a tool like Hotjar across multiple properties, consolidating on one platform might outweigh the benefits of a Shopify-specific solution.
The most valuable approach combines heatmaps with session replays and qualitative feedback. Seeing where customers click matters less if you don’t understand why they clicked there or what they expected to happen. Tools like MIDA that integrate all three data types in one platform eliminate the need to correlate insights across disconnected tools.
Frequently Asked Questions about Heatmap Tools for Shopify
Will heatmap apps slow down my Shopify store?
Modern heatmap apps use asynchronous loading, meaning their tracking scripts load after your page content renders and don’t block the initial page display. Most quality apps add less than 100ms to total page load time, which typically doesn’t impact conversion rates or SEO rankings.
You can verify performance impact by running Google PageSpeed Insights before and after installation to measure any changes to your Core Web Vitals scores. If you notice degradation, check your app’s settings for options to reduce tracking frequency or exclude certain pages from monitoring.
How much heatmap data do I need before making changes?
Collect at least 200-300 sessions per page before drawing conclusions, with higher thresholds for pages with lower traffic. Statistical significance matters more than arbitrary session counts—a pattern that appears in 250 sessions but isn’t consistent across multiple days might be noise rather than signal.
For major changes like redesigning your checkout flow, wait until you have 500+ sessions showing consistent patterns. For minor tweaks like button color or placement, 200-300 sessions usually provides enough confidence, especially if the behavior pattern is dramatic and consistent.
Can I track both mobile and desktop heatmaps separately?
All major Shopify heatmap apps automatically segment data by device type, and you can typically filter heatmaps to show only mobile or only desktop sessions. This segmentation is critical because user behavior differs significantly between devices—mobile users scroll less, tap more impulsively, and struggle with elements that work fine on desktop.
Always analyze mobile and desktop heatmaps separately rather than combining them into aggregate reports. A “successful” layout on desktop might be completely broken on mobile, and combined data would mask this critical issue.
Do heatmap tools work with Shopify Plus and headless commerce?
Most heatmap apps work seamlessly with Shopify Plus stores using standard Shopify themes. However, headless commerce implementations that separate the frontend from Shopify’s backend may require custom JavaScript integration rather than automatic app installation.
If you’re running a headless setup, contact the app provider before purchasing to confirm compatibility and understand implementation requirements. Some tools like Hotjar and Mouseflow offer custom implementations for headless architectures, while Shopify-specific apps may not support this configuration.
Are heatmap tools GDPR and privacy compliant for Shopify stores?
Reputable heatmap apps anonymize visitor data by default, removing personally identifiable information like names, email addresses, and payment details from recordings and heatmaps. Most tools also offer cookie consent integration that pauses tracking until visitors accept cookies, ensuring GDPR compliance.
Before selecting a tool, verify that the provider has GDPR-compliant data processing agreements and allows you to exclude sensitive information from recordings. You can typically configure apps to skip checkout pages entirely or mask form fields containing personal data, ensuring you capture behavior insights without compromising customer privacy.

Hien Tran
I’m Hien Tran, a Product Marketing Executive at MIDA, specializing in eCommerce growth and conversion optimization. I focus on bridging product capabilities with real merchant needs—turning insights from heatmaps, session replays, and funnel analytics into actionable strategies that drive measurable results.


