B2B Ecommerce Conversion Rates: 2026 Benchmarks and Trends
B2B ecommerce conversion rates average between 1.8% and 2.7%—roughly half what many merchants expect when they first check their analytics. The gap between B2B and B2C benchmarks catches a lot of store owners off guard, but it reflects the reality of how business buyers actually purchase.
This guide covers current benchmarks by industry, the factors that push your rate up or down, and practical ways to identify where your funnel loses buyers.
What Is B2B Ecommerce Conversion Rate
B2B ecommerce conversion rates typically average between 1.8% and 4.3%, with 2.68% often cited as a cross-industry benchmark. The rates run lower than B2C because B2B purchases involve complex, long-cycle, high-value transactions with multiple decision makers.
Your conversion rate is essentially your store’s efficiency score—it measures how well your site turns visitors into buyers. In B2B, a “conversion” might mean a completed purchase, but it often includes other valuable actions like quote requests, account registrations, or catalog downloads.
Key drivers for improvement include ERP integration, personalized pricing, and streamlined multi-step checkouts. Real-time inventory synchronization alone can deliver significant conversion lifts by eliminating uncertainty around stock availability.
How to Calculate Your B2B Conversion Rate
The formula is straightforward: divide your conversions by total visitors, then multiply by 100. If 1,000 visitors came to your site and 27 completed a purchase, your conversion rate is 2.7%.
Before you start measuring, define what counts as a conversion for your business. B2B stores typically track two types:
- Macro-conversions: Completed purchases, signed contracts, or finalized orders
- Micro-conversions: Quote requests, account creations, catalog downloads, or sample requests
Tracking both gives you a fuller picture. A visitor who requests a quote today might become a $50,000 order next month—that journey matters even if it doesn’t show up in your purchase conversion rate right away.
What Is a Good B2B Conversion Rate
“Good” depends on your industry, traffic sources, and what you’re selling. The general benchmark sits around 2.68%, though top performers regularly exceed 5%.
Context matters more than hitting an arbitrary number. A store selling complex industrial equipment to enterprise buyers will naturally convert at a lower rate than one selling office supplies to small businesses. The complexity of your product, the size of typical orders, and how much research buyers do before purchasing all influence what’s realistic.
Rather than chasing a specific percentage, focus on improving your own baseline over time. A 0.5% lift on a $2 million revenue base translates to meaningful money.
Average B2B Conversion Rates by Industry
Industry benchmarks help you understand whether your performance is typical or whether there’s room to improve. Here’s what the data shows across major B2B sectors:
| Industry | Typical Conversion Rate |
|---|---|
| Legal Services | ~7.4% |
| Education/Training | 2.5%–5% |
| Healthcare/Medical | 3%–4% |
| Professional Services | 2%–4% |
| Manufacturing | ~2.1% |
| Distribution | ~2.4% |
| Wholesale | ~2.6% |
| B2B SaaS | ~1.1% |
Why the variation? Industries with urgent buyer intent and fewer alternatives (legal services, healthcare) tend to convert higher. Industries with complex products requiring extensive research (SaaS, manufacturing) see lower rates because buyers take longer to evaluate options.
>> Checkout: 15 Proven Strategies to Improve Ecommerce Conversion Rates in 2026
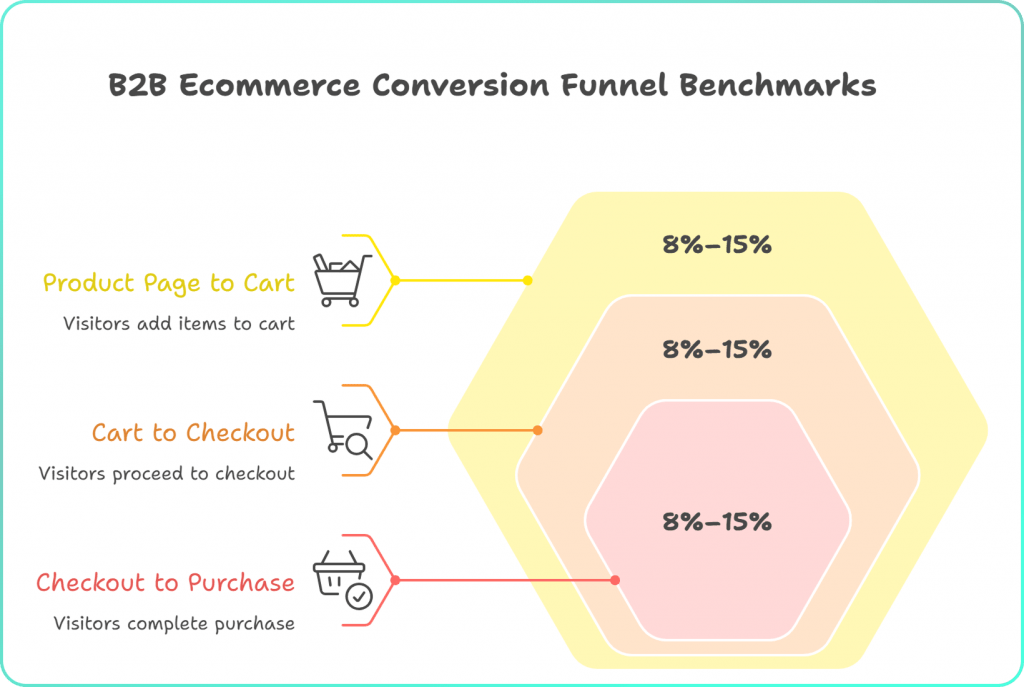
B2B Ecommerce Conversion Funnel Benchmarks
Your overall conversion rate is actually the product of several smaller conversion steps. Breaking down the funnel reveals exactly where you’re losing potential buyers.
Product Page to Cart Conversion
This step measures how many product page visitors add items to their cart—essentially, initial purchase intent. B2B stores typically see 8%–15% of product page visitors add to cart, though the number varies widely based on product complexity and pricing visibility.
Cart to Checkout Conversion
Cart abandonment happens here. Common friction points include surprise shipping costs, complex account requirements, or unclear payment terms. If buyers can’t quickly understand total costs or payment options, they leave.
Checkout to Purchase Conversion
The final step often has B2B-specific friction: approval processes, purchase order requirements, or payment term negotiations. A checkout that works fine for B2C might frustrate B2B buyers who expect net-30 terms or who need to submit orders for internal approval.
Why B2B Conversion Rates Differ from B2C
If you’ve seen B2C benchmarks hovering around 2%–3% and wondered why your B2B store converts lower, the buying process itself explains the gap.
Longer Sales Cycles and Research Phases
B2B buyers research extensively before converting. Multiple visits over weeks or months is normal, especially for high-value purchases. A visitor who doesn’t convert today might still become a customer—they’re just earlier in their journey.
Multiple Decision Makers and Approvals
Purchases often require sign-off from procurement, finance, or department heads. Even a buyer ready to purchase might wait for internal approval, extending the path to conversion.
Higher Order Values and Risk
Larger purchases mean more scrutiny. A $50,000 order gets evaluated differently than a $50 consumer purchase. Buyers want confidence they’re making the right choice.
Relationship-Based Purchasing Patterns
Many B2B buyers prefer ongoing vendor relationships over one-time transactions. They might contact sales directly rather than completing self-service checkout, which affects how conversions appear in your data.
Factors That Affect B2B Ecommerce Conversion Rates
Several variables push your rate up or down—and most are within your control.
Website Usability and Navigation
Can buyers find products quickly? Behavioral signals like rage clicks (repeated frustrated clicking on non-responsive elements) or excessive searching suggest navigation problems. If visitors struggle to locate what they want, they leave.
Product Information Depth and Accuracy
B2B buyers want specs, compatibility information, bulk pricing, and technical documentation. Incomplete product information causes drop-off because buyers can’t confidently make purchasing decisions.
Checkout Complexity
Multi-step or confusing checkouts lose buyers. Each additional form field or page adds friction. Lack of ERP integration—forcing buyers to contact sales for pricing or inventory—causes significant abandonment.
Payment and Pricing Flexibility
Net terms, purchase orders, and volume pricing are standard B2B expectations. When stores only offer credit card payment, buyers who require invoicing or net-30 terms abandon checkout.
Mobile Experience
B2B buyers increasingly research on mobile, even if they complete purchases on desktop. Poor mobile UX blocks the research phase, which blocks eventual conversion.
Trust Signals and Security
Business buyers evaluate vendor legitimacy carefully. Certifications, customer logos, reviews, and security badges all influence whether buyers feel confident completing a transaction.
How to Improve Your B2B Conversion Rate
Each tactic below ties directly to reducing friction and improving the buyer experience.
1. Simplify Your Checkout Process
Reduce steps, allow guest checkout for first-time orders, and show progress indicators. Watching session replays reveals exactly where buyers hesitate or abandon—you might discover that a specific form field or payment step causes consistent drop-off.
2. Optimize Product Pages for B2B Buyers
Add detailed specifications, downloadable resources, and visible bulk pricing. Heatmaps show which information buyers actually seek versus what they ignore, helping you prioritize what to display prominently.
3. Improve Mobile Usability
Test navigation, forms, and checkout on mobile devices. Mobile-first optimization captures research-phase buyers who might convert later on desktop.
4. Add Flexible Payment and Net Terms
Offer purchase orders, net-30/60 terms, and multiple payment methods. This single change can reduce abandonment from payment friction.
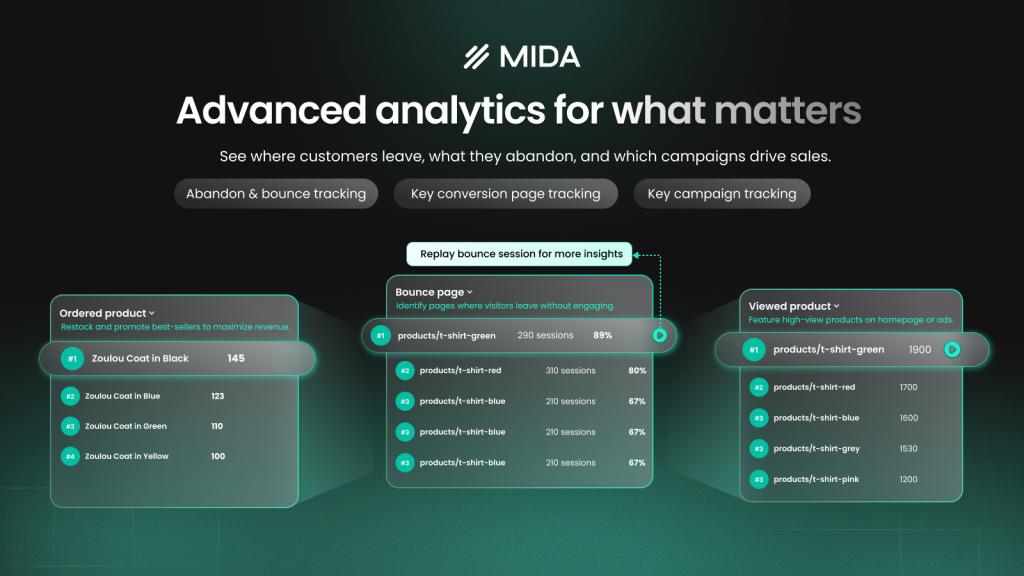
5. Use Behavioral Analytics to Find Friction
Session recordings and heatmaps identify exactly where buyers struggle. Tools like MIDA connect behavior directly to revenue outcomes—you can see which sessions led to abandoned checkouts versus completed orders, then watch those specific moments to understand what went wrong.
6. Segment and Personalize the Buying Experience
Show different content or pricing to different buyer types. Personalized pricing tailored to specific clients can improve conversions meaningfully.
7. Test High-Impact Pages Continuously
A/B test checkout flows, product pages, and landing pages. Use evidence from behavior data to guide what to test rather than guessing.
B2B Conversion Rate Optimization Tools
Different tool categories support different aspects of conversion optimization.
Analytics and Behavior Tracking Tools
Session replay, heatmaps, and funnel analytics reveal the “why” behind your numbers. MIDA offers Shopify-native behavior tracking with order-linked recordings—you can click from an abandoned checkout directly into the session where it happened. Other options include Hotjar, FullStory, and Microsoft Clarity.
- Session replay: Watch real buyer journeys to see friction points
- Heatmaps: Visualize where buyers click, scroll, and ignore content
- Funnel analytics: Identify which checkout step loses the most buyers
A/B Testing Platforms
Tools like VWO and Optimizely let you run experiments on pages and flows, measuring which variations convert better.
Personalization and Recommendation Software
Personalization tools tailor content, pricing, and product recommendations to specific buyer segments based on behavior and purchase history.
Key Metrics to Track Alongside B2B Conversion Rate
Conversion rate alone doesn’t tell the full story. Complementary metrics provide context:
- Average order value: Higher values can offset lower conversion rates
- Cart abandonment rate: Measures friction in the buying process
- Checkout abandonment rate: Pinpoints where the final conversion fails
- Customer acquisition cost: Balances conversion volume against marketing spend
- Returning vs. new visitor conversion: Shows whether you’re retaining customers or only acquiring new ones
Funnel Conversion Rate Trends in B2B Ecommerce
Several patterns are reshaping how B2B buyers convert.
Self-Service B2B Buying
More B2B buyers prefer completing purchases without contacting sales. Stores that support full self-service journeys—including pricing visibility, inventory availability, and flexible payment—capture more of this buyer segment.
Mobile-First B2B Experiences
Research and even purchasing are shifting to mobile, especially among mid-market buyers. Mobile optimization is no longer optional for B2B stores.
AI-Powered Conversion Optimization
AI tools for personalization, automated insights, and predictive analytics are becoming standard. AI surfaces patterns in buyer behavior that would take humans much longer to identify.
How to Start Optimizing Your B2B Store Conversion Rate
Here’s a practical starting point:
- Define your primary conversion action: Decide what counts as a conversion for your business
- Establish your baseline: Measure your current conversion rate before making changes
- Install behavior analytics: Use session replay and heatmaps to see real buyer behavior
- Identify your biggest drop-off point: Focus on the funnel stage losing the most buyers
- Run your first test: Make one change, measure the impact, then iterate
Try MIDA for free to connect behavior data directly to your Shopify orders and see exactly where buyers drop off.
FAQs About B2B Ecommerce Conversion Rates
Is a 2.5% conversion rate good for B2B ecommerce?
A 2.5% conversion rate is generally above average for B2B ecommerce. Whether it’s “good” for your store depends on your industry, product complexity, and traffic quality. Legal services might expect higher; complex manufacturing might see lower.
How often should you measure B2B ecommerce conversion rates?
Track conversion rates weekly or monthly to spot trends. Avoid reacting to daily fluctuations—B2B traffic volumes can be lower and more variable than B2C, making daily numbers noisy.
Should B2B conversion rate calculations include repeat customers?
You can calculate both, but separating new versus returning visitor conversion rates gives clearer insight. New visitor conversion measures acquisition effectiveness; returning visitor conversion reflects customer experience and retention.
What is a good checkout conversion rate for B2B stores?
Checkout-to-purchase conversion typically runs significantly higher than overall site conversion—often 30%–50% or more. If yours is low, focus on reducing friction in your checkout flow: payment options, form complexity, and approval processes.
How do you benchmark B2B conversion rates with low traffic volume?
With limited traffic, focus on longer measurement windows (monthly or quarterly) and prioritize qualitative insights. Session recordings reveal friction points even when you don’t have enough volume for statistically significant rate comparisons.


