
Most heatmaps show where users click, scroll, or interact. But those signals don’t tell you what truly matters — whether those interactions generate revenue. Revenue Click Heatmaps and Revenue per Click (RPC) in MIDA are designed to bridge that gap by connecting user behavior directly with actual Shopify orders, helping you move beyond engagement metrics and focus on what drives real business results.
What is Revenue Click Heatmap & Revenue per Click?
Revenue Click Heatmap visualizes only the clicks that come from sessions with actual purchases. Instead of showing all user interactions, it highlights where paying users clicked, allowing you to clearly see which elements contribute to revenue.
Revenue per Click (RPC) takes it one step further by assigning a monetary value to each click. Rather than asking “Where do users click?”, you can now answer a much more important question:
“Which clicks actually make money — and how much are they worth?”
For example, if a banner generates $200 from 10 clicks, its RPC is $20. This means every click on that banner, on average, brings in $20 in revenue — making it a highly valuable element, even if total clicks are low.
How to Use Revenue Click Heatmap in MIDA
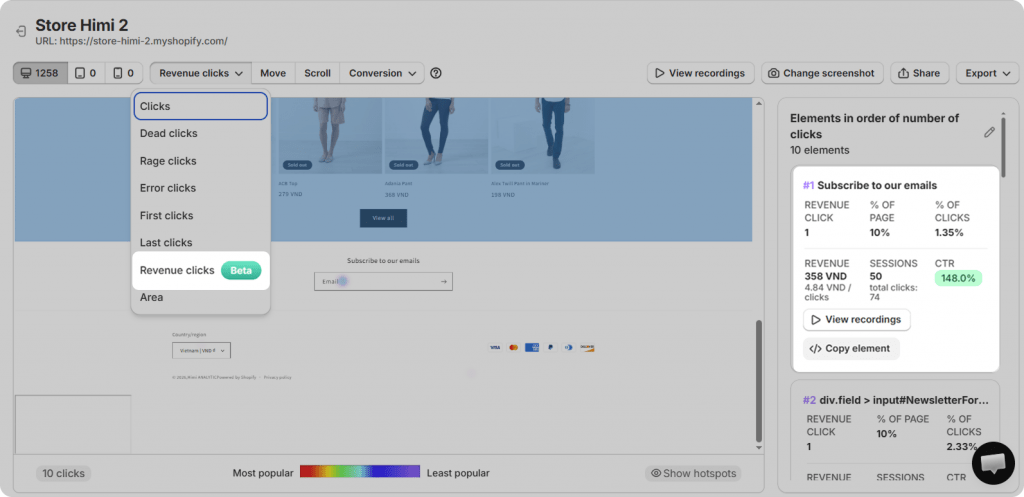
To access this feature, go to Heatmap → Click Map → select “Revenue Clicks”.
In this mode, the heatmap filters out all non-converting sessions and only displays interactions from sessions that resulted in revenue. This allows you to focus purely on high-value behavior instead of noise.
Each highlighted element shows key metrics such as:
- Number of revenue-related clicks
- Total revenue generated from those clicks
- Revenue per click (RPC)
- CTR and session data
For instance, you might see:
- Revenue Clicks (1 click) → This element has 1 click coming from sessions that resulted in a purchase
- % of Page (10%) → Out of all revenue-generating clicks on the page, 10% come from this element
- % of Clicks (1.35%) → Out of all clicks on this element (74), 1.35% actually led to revenue
- Revenue (358 VND) → Total revenue generated from sessions where users clicked this element
- Revenue per Click (4.84 VND/click) → On average, each click on this element generates 4.84 VND (= 358/74)
- CTR (148%) = Clicks (74) / Sessions (50) → Shows how many users who saw the element actually clicked on it
In simple terms, CTR shows how attractive an element is, % of clicks shows how well it converts, and revenue per click shows how valuable each click actually is.
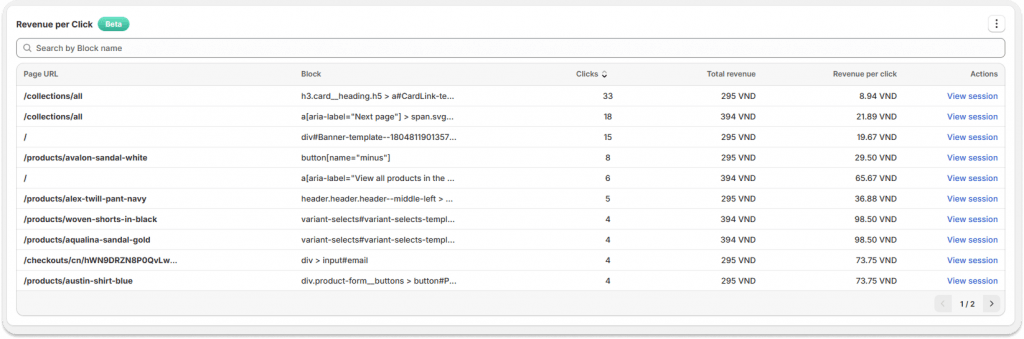
Revenue per Click Dashboard in Analytics
In the Analytics section, the Revenue per Click dashboard provides a structured, sortable view of all elements across your store.
Each row represents a clickable element and includes:
- URL: The page where the element appears
- Element Name / Selector: Identifier of the element (banner, CTA, product card, etc.)
- Total Clicks: Number of interactions
- Total Revenue: Revenue generated from sessions with those clicks
- Revenue per Click (RPC): Average revenue per click
- View Sessions: Relay sessions where users clicked the element and generated revenue
This table allows you to quickly identify which elements are driving attention — and more importantly, which ones are driving revenue.
You can sort by clicks to find popular elements, or by revenue and RPC to uncover your top-performing “money drivers.”
Understanding the Metrics
Each metric plays a specific role in evaluating performance:
- Clicks show how often users interact with an element
- Sessions reflect how many users actually engage with it
- Total Revenue represents the real business outcome
- Revenue per Click (RPC) measures the average value of each interaction
The formula is simple:
Revenue per Click = Total Revenue / Total Clicks
This is the most critical metric, as it reveals whether an element is truly effective — not just engaging.
Key Use Cases
Identify false attention
Some elements attract a high number of clicks but generate little revenue. These may distract users rather than convert them, signaling a need to adjust messaging, design, or placement.
Discover hidden revenue drivers
Other elements may receive fewer clicks but generate high revenue per click. These are high-impact opportunities that should be made more visible or prioritized in your layout.
Optimize layout based on revenue
Instead of arranging your page based on assumptions or aesthetics, you can now prioritize elements that demonstrably contribute to revenue.
Run smarter A/B tests
Rather than measuring success by click-through rate alone, you can evaluate experiments based on Revenue per Click uplift, ensuring optimizations translate into real business impact.
Improve the conversion funnel
By analyzing which clicks lead to revenue, you can identify friction points and optimize the user journey from first interaction to purchase.
Turning Insights into Action
Revenue Click Heatmaps become even more powerful when combined with session replay. For example, an element may receive frequent clicks but generate low revenue. By reviewing session recordings, you might notice hesitation, repeated clicks, or confusion — clear signals of friction.
This shifts your focus from traffic to experience. Instead of asking how to get more clicks, you start improving how existing clicks convert into revenue.
Built for Real Shopify Stores
Designed for Shopify and Shopify Plus merchants, this feature works across different themes, layouts, and traffic levels. With advanced filtering, bot session exclusion, and full-funnel analytics, MIDA ensures that every insight is based on real user behavior — not inflated or misleading data.
In summary, revenue click heatmap and Revenue per Click help you stop optimizing for clicks and start optimizing for revenue. By revealing which interactions truly drive business results, they give you the clarity needed to make smarter decisions and unlock meaningful growth.


