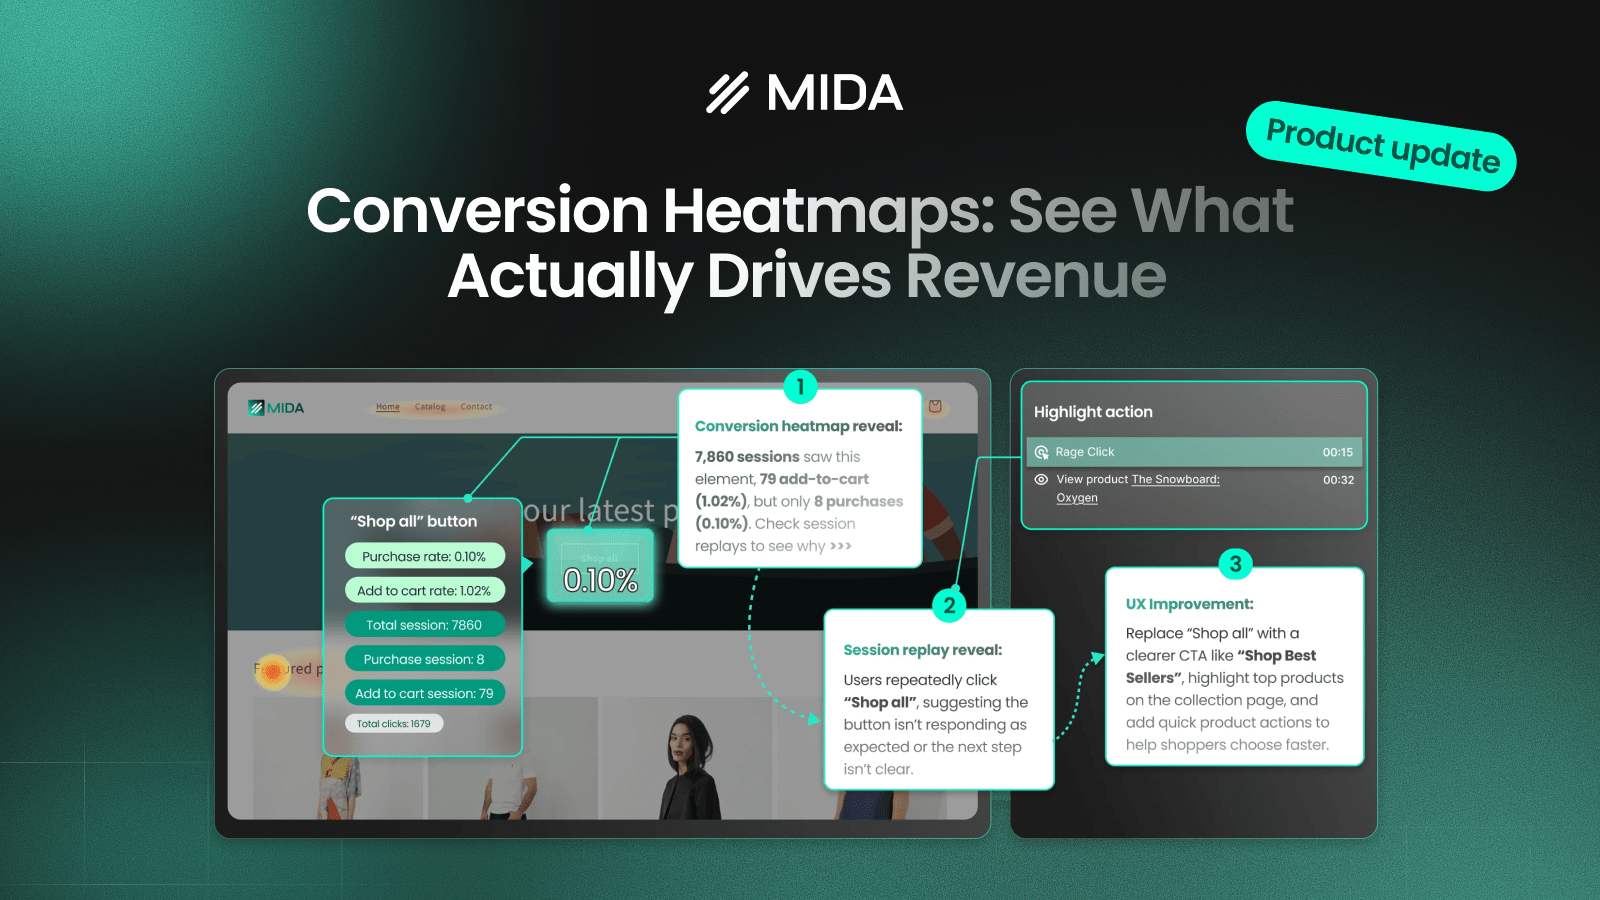

Most heatmaps show where users click, scroll, or move. But those signals don’t tell you what truly matters — whether those interactions lead to revenue. Conversion Heatmaps in MIDA are designed to bridge that gap by showing which elements on your store actually contribute to conversions, helping you move beyond assumptions and focus on what works.
What is a Conversion Heatmap?
A Conversion Heatmap visualizes the likelihood that a user interaction leads to a conversion, displayed as a percentage directly on each element. Instead of just tracking behavior, it connects actions to outcomes. This means you’re no longer asking “Where do users click?” but rather “Which elements actually drive purchases?”
For example, if a product image shows a 2.4% purchase rate, it means that 2.4% of sessions interacting with that image resulted in an order. This gives you a much clearer understanding of what’s truly effective on your site.
Types of Conversion Maps in MIDA
MIDA currently supports two types of conversion analysis, each designed for a different stage of the customer journey.
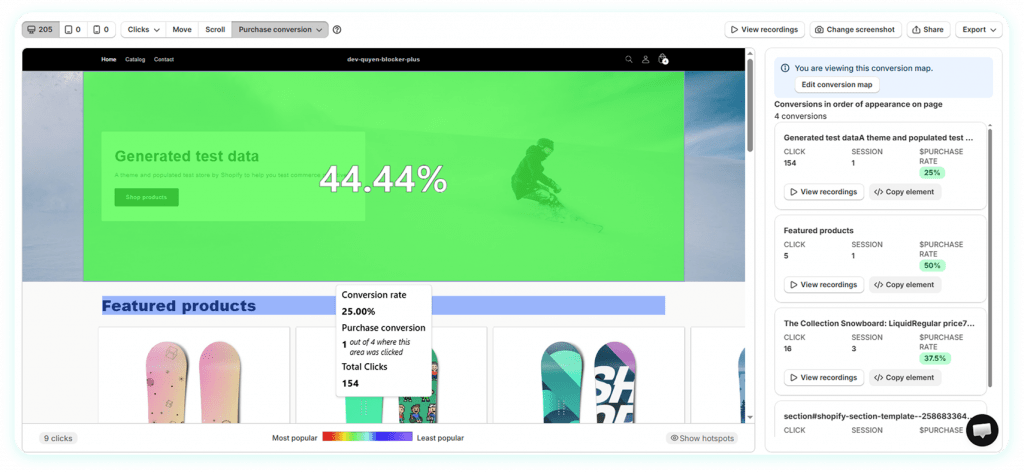
Purchase conversion map
The Purchase Conversion Map shows how likely an element is to lead to a completed order, based on real session data. Each element is enriched with metrics that connect interaction directly to revenue outcomes, helping you evaluate not just performance, but actual business impact.
For each element, you can see:
- Purchase rate (%): The percentage of sessions that interacted with this element and ended in a purchase
- Total sessions: How many sessions saw or interacted with the element
- Purchase sessions: Number of sessions that resulted in an order after interacting
- Total clicks: Engagement level with the element
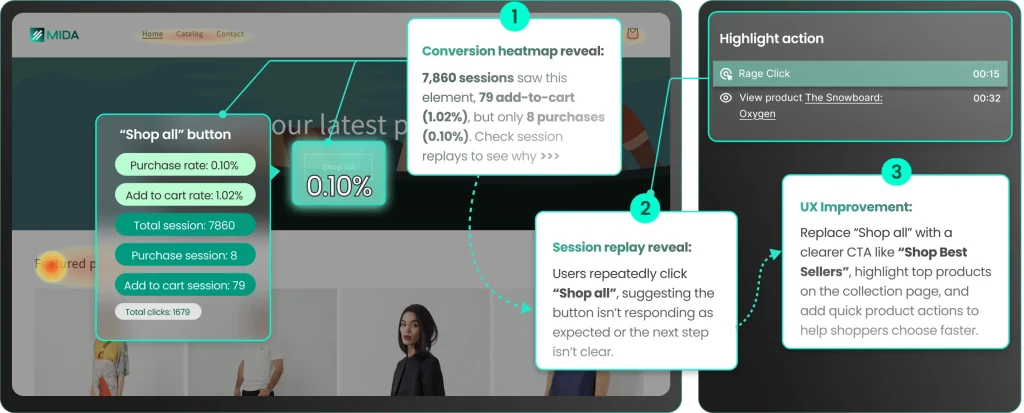
For example, an element might show:
- 7,860 sessions
- 79 add-to-carts (1.02%)
- 8 purchases (0.10%)
At a glance, this reveals a critical insight: while the element drives interaction and even some buying intent, very few users actually convert. This signals a drop-off between intent and purchase, often caused by unclear navigation, weak CTA, or friction in the next step.
This map is especially useful for identifying:
- Elements that truly drive revenue (high purchase rate)
- Elements that attract attention but fail to convert (high clicks, low purchase rate)
- Hidden friction points right before the final decision
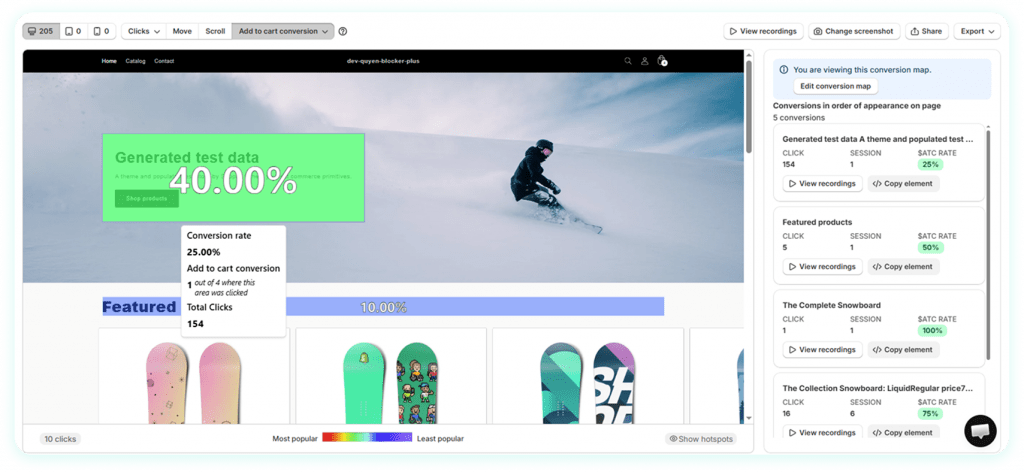
Add to cart conversion map
Add to Cart Conversion Map focuses on purchase intent. It shows which elements encourage users to add products to their cart, allowing you to identify early signals of interest and optimize the journey before checkout.
The Add to Cart Conversion Map focuses on an earlier stage of the journey: what makes users show intent by adding products to their cart. Instead of looking at final purchases, it helps you understand which elements successfully push users closer to conversion.
Each element includes:
- Add-to-cart rate (%): Percentage of sessions that added a product to cart after interacting
- Total sessions
- Add-to-cart sessions
- Total clicks
Using the same example:
- 7,860 sessions
- 79 add-to-carts → 1.02% ATC rate
This tells you that while the element does generate some interest, the conversion to intent is relatively low compared to the total exposure. When compared side-by-side with the purchase rate (0.10%), you can clearly see where the biggest drop-offs happen.
This map helps you:
- Identify elements that successfully generate interest
- Detect weak CTAs or unclear product discovery paths
- Optimize the journey before users reach checkout
Connecting both maps for full-funnel insight
The real power comes from using both maps together.
- High ATC rate + Low Purchase rate → friction after intent (e.g. checkout issues, pricing concerns)
- Low ATC rate + High clicks → weak messaging or unclear CTA
- High performance on both → elements worth scaling or highlighting more
By comparing these metrics across elements, you can clearly map where users drop off — and more importantly, why. Instead of guessing what to fix, you now have a structured way to prioritize optimizations across the entire funnel, from first interaction to final purchase.
Turning Insights into Action
Conversion Heatmaps become even more powerful when combined with session replay. For instance, an element might receive a high number of clicks but show a very low purchase rate. By reviewing session recordings, you may notice users repeatedly clicking the same element — a sign of confusion or unmet expectations.
This kind of insight shifts your perspective. The problem is no longer about traffic, but about user experience. With that clarity, you can take targeted actions such as improving CTA clarity, highlighting relevant products, or reducing friction in key steps of the journey.
Edit Areas for More Accurate Analysis
Not every layout is straightforward, especially with custom sections or complex designs. With Edit Areas, you can manually define, group, or exclude specific zones on your heatmap. This ensures your analysis reflects how your content is actually structured, leading to more precise and actionable insights.
Built for Real Shopify Stores
Conversion Heatmaps are designed to work across different store sizes, themes, and traffic conditions. Combined with advanced filtering, bot session exclusion, and full-funnel analytics, MIDA ensures that the insights you see are based on real user behavior — not noise.
In conclusion, conversion Heatmaps help you stop optimizing for clicks and start optimizing for conversions. By revealing what truly drives revenue, they give you the clarity needed to make smarter decisions and unlock meaningful growth.


