Top 12 Shopify Analytics Apps to Use in 2026
Shopify’s built-in analytics tell you what happened in your store. They won’t tell you why your conversion rate dropped last week or which product page is quietly bleeding revenue.
That’s where third-party analytics apps come in—tools that go deeper into attribution, profitability, customer behavior, and custom reporting. This guide covers 12 of the best Shopify analytics apps available in 2026, what each one does well, and how to choose the right fit for your store.
What are Shopify analytics apps
Shopify offers built-in analytics with pre-built reports for sales, marketing, and customers. However, many merchants turn to specialized analytics apps for deeper insights, AI-powered features, better marketing tracking for platforms like GA4 and Meta, or custom reporting that Shopify’s native tools don’t provide.
The core difference comes down to depth. Shopify’s default reports tell you what happened—how many orders, which products sold, where traffic came from. Analytics apps go further by connecting outcomes to the behaviors that drove them, whether that’s tracking which ad campaigns actually generate profit or showing you exactly where shoppers hesitate before abandoning their carts—an event with an average rate of 70.22%.
For basic performance checks, Shopify’s reports work fine. Once you’re running paid ads across multiple channels, optimizing product pages, or trying to understand why conversion rates differ between mobile and desktop—mobile cart abandonment reaches 80.2% compared to 70% on desktop—you’ll likely hit the ceiling of what native analytics can show you.
Top 12 Shopify analytics tools for your store
| App | Best For | Key Strength | Pricing |
| MIDA Analytics | Behavior-to-revenue insights | Session replays linked to orders | Free tier available |
| Lucky Orange | All-in-one behavior analytics | Integrated live chat | Paid plans from $32/mo |
| Triple Whale | Ad attribution and profitability | Server-side tracking | Paid plans from $99/mo |
| Polar Analytics | Data unification and AI insights | AI-powered reporting | Paid plans from $300/mo |
| Lifetimely | Customer lifetime value | LTV projections and cohorts | Paid plans from $34/mo |
| BeProfit | Profit tracking | Expense breakdown | Free tier available |
| Better Reports | Custom report building | Flexible report automation | Paid plans from $19/mo |
| Metorik | Reporting with email automation | Segmentation and automation | Paid plans from $20/mo |
| Mipler | Simple custom reports | Easy data exports | Free tier available |
| Report Pundit | Highly customizable reports | Compliance-ready reporting | Free tier available |
| Google Analytics | Traffic and audience analysis | Free, industry-standard | Free |
| Heap Analytics | Automatic event capture | Retroactive analysis | Free tier available |
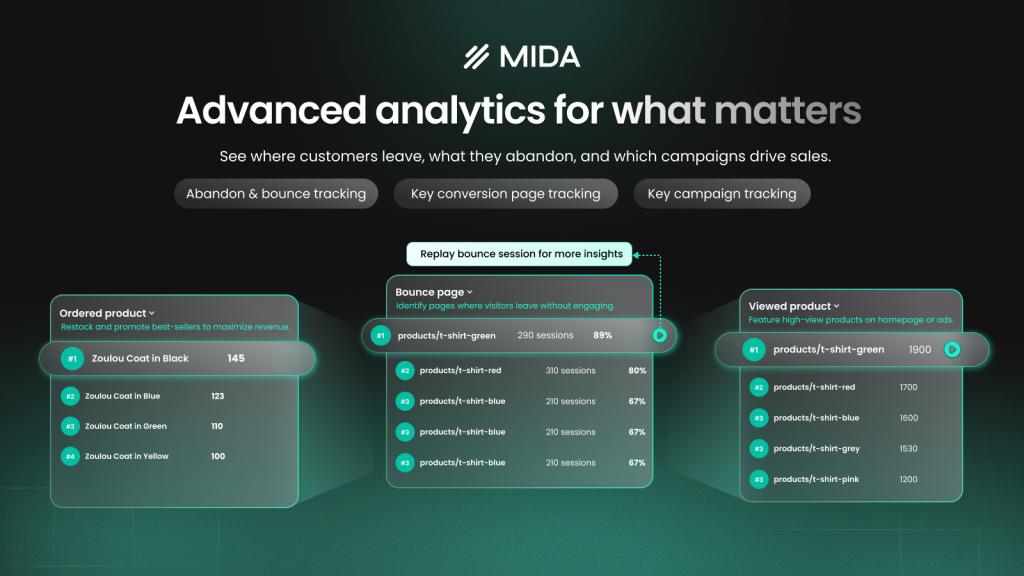
MIDA Analytics
MIDA Analytics connects Shopify metrics directly to session replays, heatmaps, and surveys. Instead of just seeing that conversions dropped, you can watch exactly where shoppers got confused or gave up. The platform is built specifically for Shopify, which means it understands checkout events, cart values, and customer profiles that general tools often miss.
What sets it apart is the direct link between quantitative data and qualitative behavior. You can click from a funnel drop-off straight into the session replays where that abandonment happened.
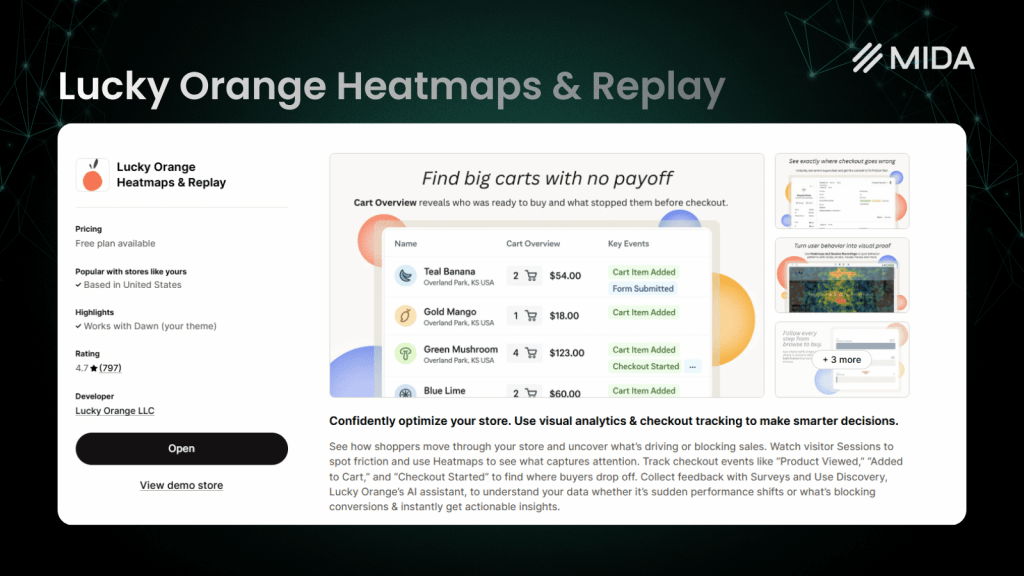
Lucky Orange
Lucky Orange combines heatmaps, session recordings, and live chat in a single platform. It’s been around for years and works across multiple website platforms, not just Shopify. The integrated live chat feature lets you reach out to visitors in real-time based on what you’re observing in their session.
For stores wanting to consolidate behavior analytics and customer communication, it offers convenience. The platform remains a popular choice for merchants who value having everything in one dashboard.
Triple Whale
Triple Whale focuses on attribution—specifically, helping you understand which ad campaigns actually drive profitable purchases, not just clicks. The “Triple Pixel” provides server-side tracking that captures conversions even when browser-based tracking fails due to privacy restrictions.
If you’re spending significantly on Meta, Google, or TikTok ads, Triple Whale helps you see true return on ad spend. The profit dashboard pulls in your costs and revenue to show real margins, though the platform is primarily designed for paid media analysis rather than on-site behavior.
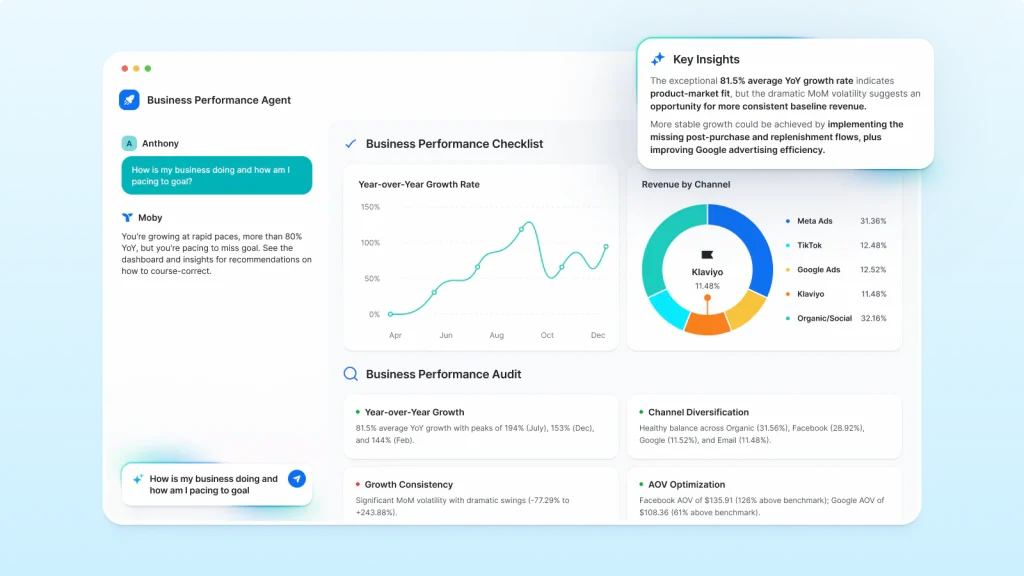
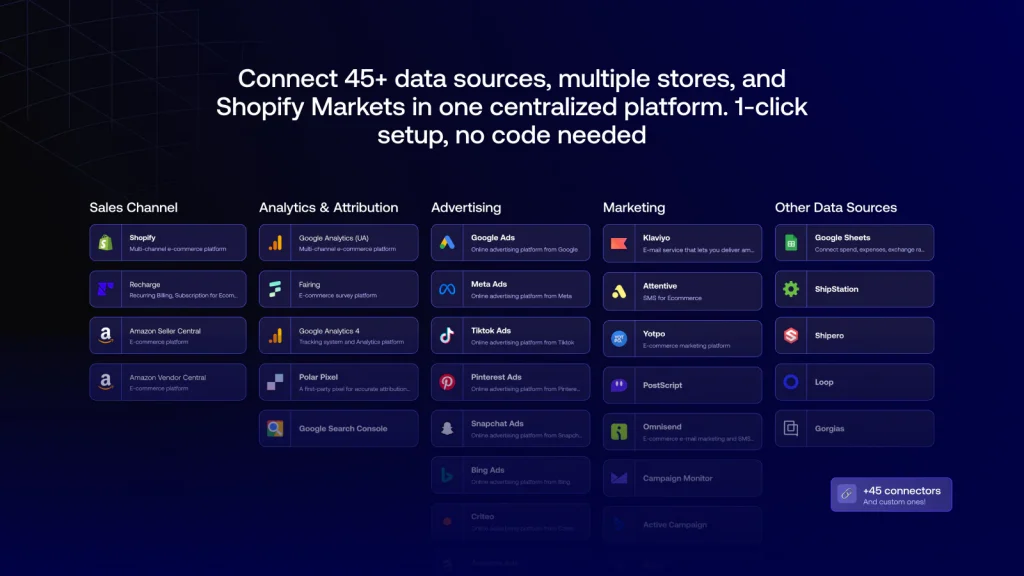
Polar Analytics
Polar Analytics unifies data from your ads, email marketing, and Shopify store into one AI-powered dashboard. The platform tracks LTV (customer lifetime value), ROAS (return on ad spend), and profit/loss across channels.
The AI assistant can generate reports and answer questions in plain language—you ask “which campaign had the best ROAS last month?” and get an answer without building custom queries. For larger stores managing multiple marketing channels, this centralization saves significant time.
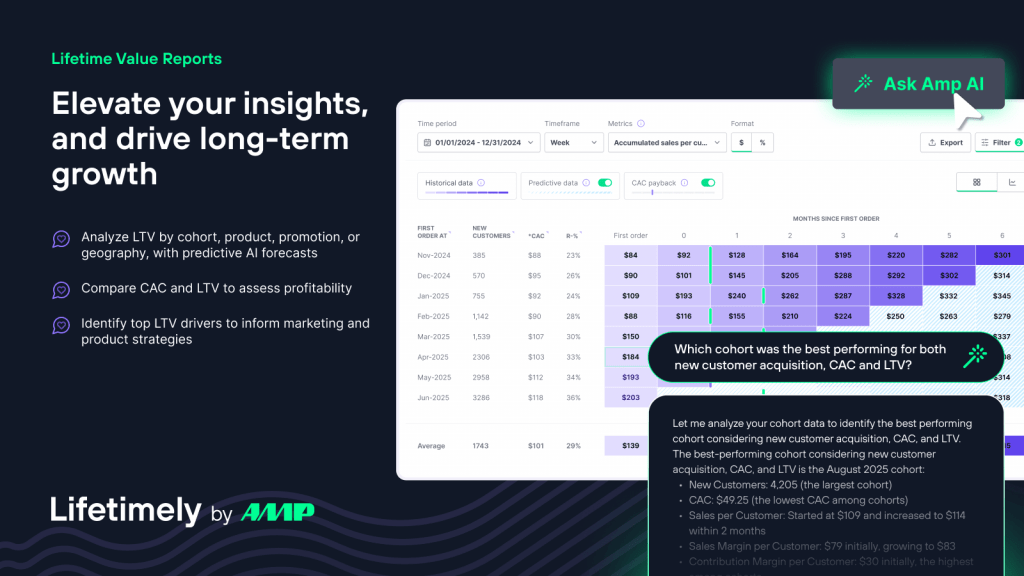
Lifetimely
Lifetimely specializes in customer lifetime value and cohort analysis. Cohort analysis groups customers by when they first purchased, then tracks how their behavior changes over time. If your business depends on repeat purchases or subscriptions, understanding how customer value develops becomes critical for making smart acquisition decisions.
The platform shows LTV projections broken down by acquisition source, so you can see whether customers from Instagram ads are worth more over time than those from Google.
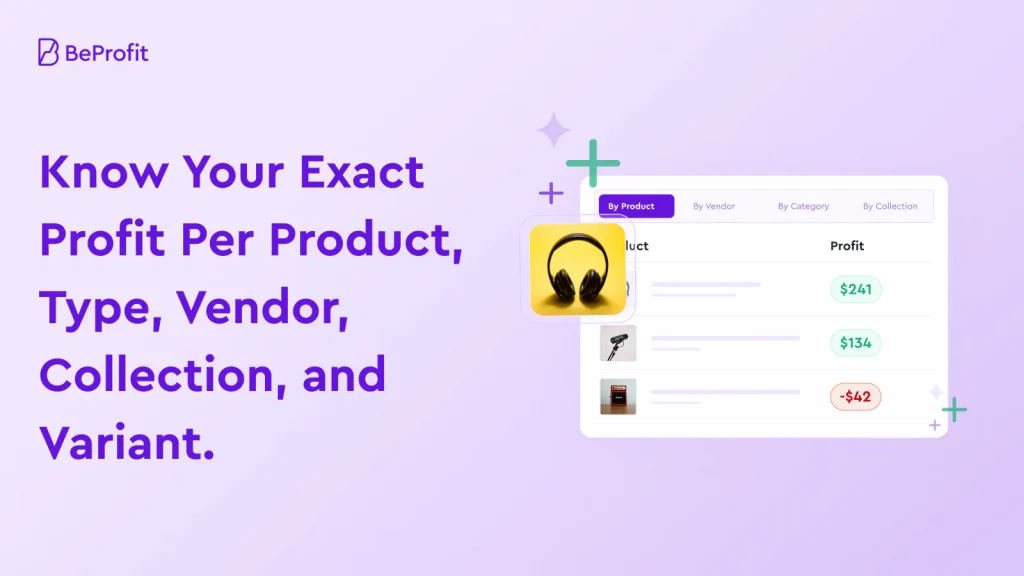
BeProfit
BeProfit focuses on one thing: showing you your true profit after all costs are accounted for. It pulls in cost of goods sold, ad spend, shipping costs, transaction fees, and returns to calculate actual margins—something Shopify’s native reports don’t do automatically.
For merchants who’ve been surprised by how little profit remains after expenses, BeProfit provides clarity. The detailed expense breakdown helps identify where money is leaking.
Better Reports
Better Reports is a custom report builder that lets you create almost any report from your Shopify data. You can schedule reports to run automatically and export them in various formats for sharing with your team or accountants.
The flexibility appeals to stores with specific reporting requirements that Shopify’s default reports don’t address. If you want a weekly report showing sales by product variant, filtered by customer tag, sorted by profit margin—Better Reports can build it.
Metorik
Metorik combines advanced reporting with email automation and customer segmentation. Beyond showing you data, it lets you act on it by sending automated emails to specific customer segments based on their purchase behavior.
The integration of analytics and marketing tools means you can identify a segment (say, customers who bought once but haven’t returned in 60 days) and immediately set up a win-back campaign targeting them.
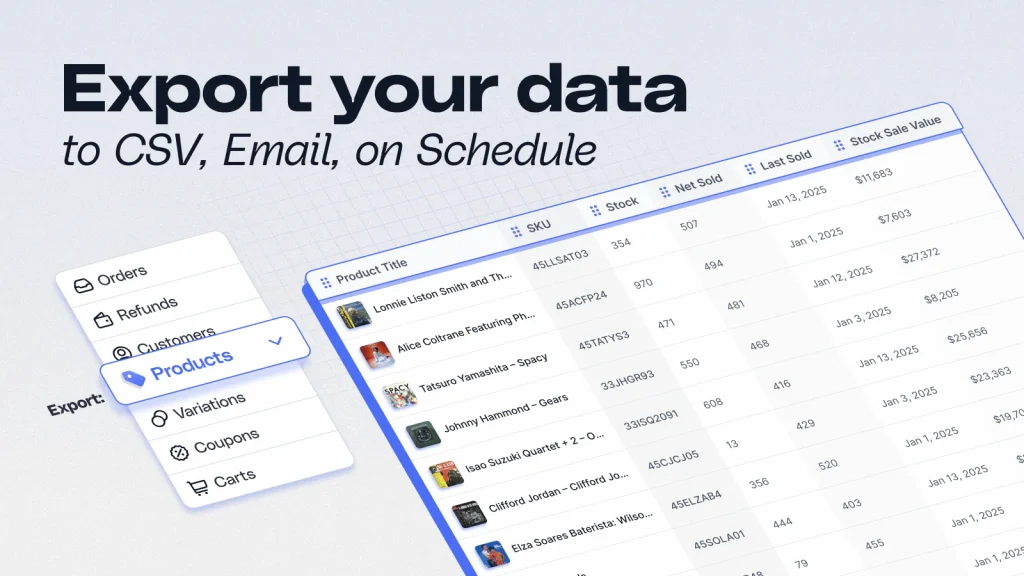
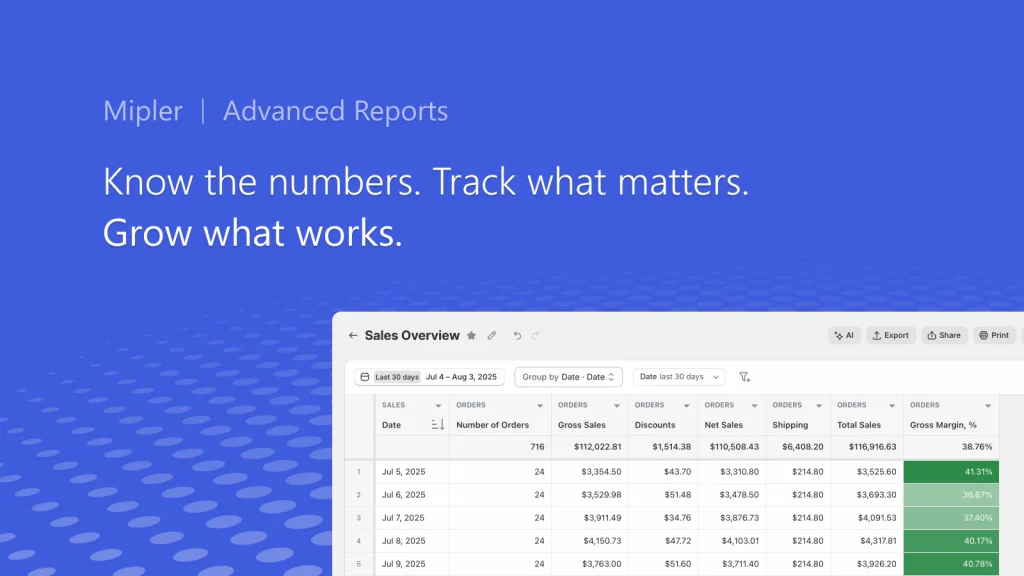
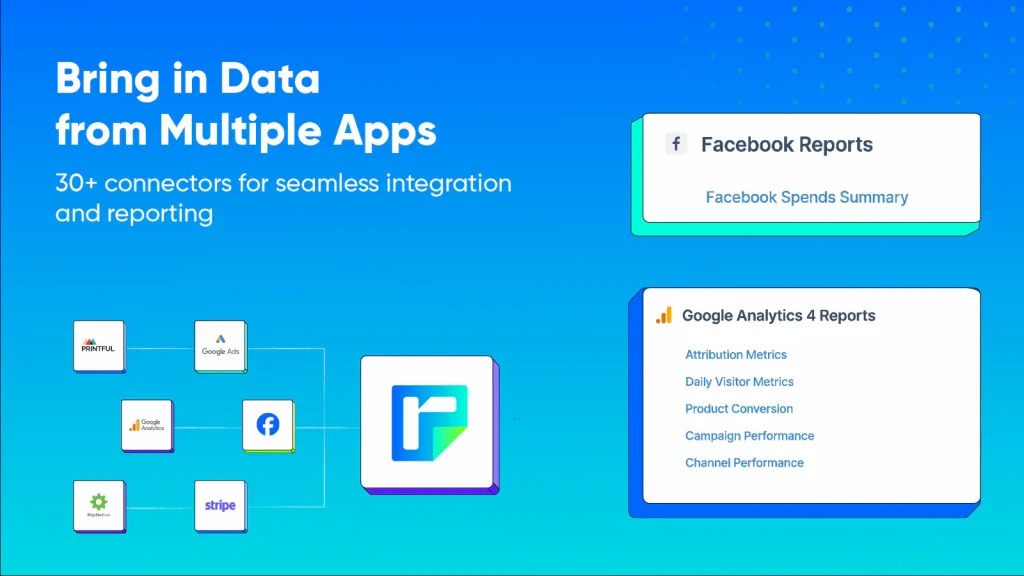
Mipler
Mipler offers straightforward custom reports and data exports without the complexity of more advanced platforms. It’s designed for stores that want reliable reporting but don’t require sophisticated analytics features.
The simplicity is the point. You can create essential business reports, export them to spreadsheets, and share them with stakeholders—all without a steep learning curve.
Report Pundit
Report Pundit provides highly customizable report building with the flexibility to connect to other data sources. It’s particularly useful for stores with compliance requirements or very specific reporting formats that other tools can’t accommodate.
The platform can generate reports that pull data from multiple sources, making it suitable for businesses that require comprehensive, custom reporting for financial or regulatory purposes.
Google Analytics
Google Analytics (GA4) is the free, industry-standard web analytics tool. Most Shopify stores already have it installed, and it provides solid baseline data on traffic sources, user demographics, and site behavior.
While it’s powerful and free, GA4 requires more setup and expertise to use effectively for ecommerce. It doesn’t natively understand Shopify’s data structure, so you’ll want proper configuration to track purchases and product interactions accurately.
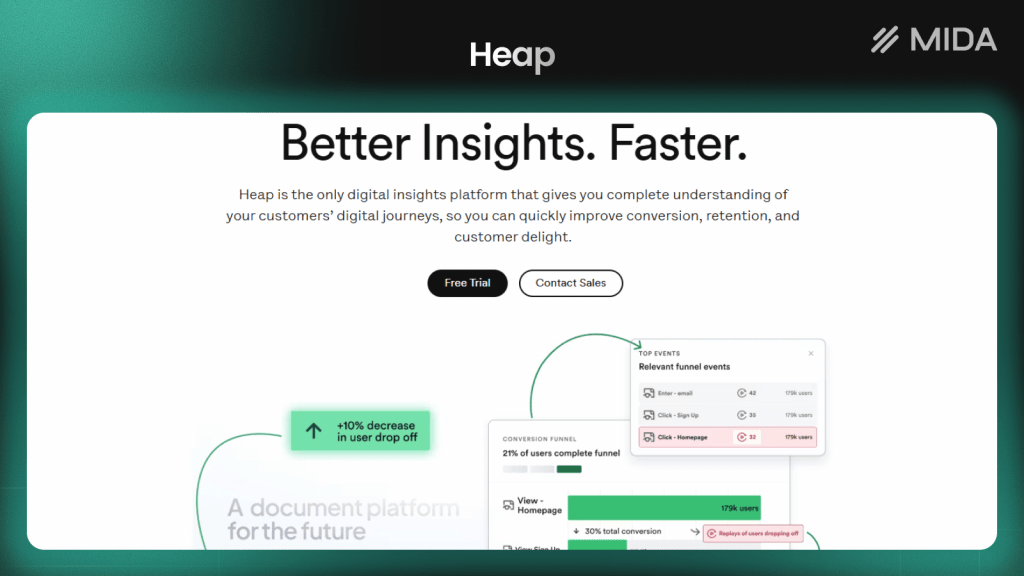
Heap Analytics
Heap automatically captures all user interactions—clicks, form fills, page views—without requiring you to manually tag events. This “autocapture” approach means you can analyze behaviors retroactively, even if you didn’t think to track them originally.
For product teams who want flexibility in their analysis, Heap’s approach is appealing. You can ask questions about past user behavior without having set up tracking in advance. However, it’s a general-purpose tool rather than Shopify-specific.
Why Shopify analytics apps matter for store growth
With global ecommerce expected to reach $6.88 trillion in 2026, the gap between Shopify’s native analytics and what you actually need to know becomes apparent once you start asking harder questions. “How many orders did we get?” is easy. “Why did our conversion rate drop 15% on mobile last week?” requires different tools.
- Calculate true profitability: Third-party apps factor in costs like ad spend, shipping, returns, and transaction fees that Shopify’s reports don’t include. A product might look profitable based on revenue alone, only to lose money once all costs are counted.
- Discover the ‘why’ behind sales: Behavior tools reveal where customers hesitate, rage-click on broken elements, or abandon carts using heatmaps and session recordings. Numbers tell you something went wrong; session replays and heatmaps show you exactly what.
- Measure marketing ROI accurately: Advanced attribution models and server-side tracking help measure which ads actually drive purchases. With browser-based tracking becoming less reliable due to privacy changes, this accuracy matters more than ever.
- Automate data analysis: AI assistants and scheduled reports surface key insights automatically. Instead of logging in daily to check dashboards, you receive alerts when something warrants attention.
How to choose the best Shopify analytics tool
Different tools solve different problems, so starting with your primary goal helps narrow the field quickly. Are you trying to understand why visitors don’t convert? Track which ads are profitable? Build custom reports for your finance team? The answer shapes which category of tool you want.
- Primary goals: Attribution tools like Triple Whale excel at ad tracking. Behavior tools like MIDA show you what visitors actually do on your site. Reporting tools like Better Reports create custom data exports. Profit tools like BeProfit calculate true margins.
- Shopify integration depth: Native Shopify apps typically offer deeper, more contextual ecommerce insights because they understand checkout events, customer profiles, and order data. General-purpose tools may require more configuration to track Shopify-specific behaviors.
- Ease of use: Consider who will actually use the tool daily. Technical teams might prefer raw data access and API flexibility. Marketing and business users often want visual dashboards they can interpret without SQL knowledge.
- Pricing and scalability: Compare pricing models carefully—some charge by order volume, others by features or team seats. A tool that’s affordable at 100 orders per month might become expensive at 10,000.
Tip: If you’re unsure where to start, begin with a behavior analytics tool that shows you what visitors actually do on your site. Understanding the “why” behind your metrics often reveals which other tools you’ll want next.
Key features to look for in Shopify analytics tools
Not every feature matters equally for every store, but certain capabilities tend to separate useful tools from frustrating ones.
- Real-time data and live dashboards: The ability to see current visitor activity, today’s sales, and live trends without waiting for data processing delays. During a product launch or sale, real-time visibility becomes essential.
- Custom reports and flexible dashboards: Pre-built templates work for common questions, but your business likely has specific requirements. The tool can let you create reports tailored to your questions, not just rely on what the vendor thought you’d want.
- Marketing attribution and UTM tracking: Tracking which campaigns, channels, and touchpoints drive conversions from first click to purchase. UTM parameters are tags added to URLs that identify traffic sources. Without proper attribution, you’re guessing which marketing efforts actually work.
- Session replay and heatmaps: Visual tools that show exactly how customers interact with your pages—clicks, scrolls, hesitation, rage clicks. A rage click is when a visitor clicks repeatedly on an element out of frustration, often because something isn’t working as expected.
- Customer segmentation and cohort analysis: Grouping customers by behavior, purchase patterns, or acquisition source reveals how different segments perform. A customer acquired through Instagram might behave very differently from one who found you through Google.
- API access and data exports: For teams with data warehouses or BI tools, the ability to sync analytics data externally matters. Check whether the tool offers API access, CSV exports, or direct integrations with platforms like BigQuery or Looker.
How to set up a Shopify analytics app
Most analytics apps have streamlined their setup process, but a few steps ensure you’re capturing accurate data from the start.
1. Install and connect your Shopify store
Most apps install directly from the Shopify App Store with one-click authorization. The app requests permissions to access your store data—orders, customers, products—and begins collecting information immediately. No code changes are typically required for basic setup.
2. Configure conversion and goal tracking
Define what counts as a conversion for your store. For most merchants, that’s completed purchases, but you might also want to track add-to-carts, email signups, or account creations. Setting up conversion tracking correctly ensures the app measures what matters to your business.
3. Set up marketing channel attribution
Connect your ad accounts (Meta, Google, TikTok) if the tool supports attribution tracking. Equally important: ensure your UTM parameters are consistent across campaigns. Inconsistent UTMs lead to fragmented data where the same campaign appears under multiple names.
4. Review data privacy and compliance settings
Before going live, check cookie consent settings, data retention policies, and GDPR/CCPA compliance options. Many tools offer built-in consent management, but you’ll want to verify the configuration matches your legal requirements and customer expectations.
Find the right Shopify analytics app for your store
The best analytics app depends entirely on what questions you’re trying to answer. Attribution-focused merchants running significant ad spend might prioritize Triple Whale or Polar. Stores focused on repeat purchases might start with Lifetimely for LTV analysis. Merchants struggling with conversion rates often benefit most from behavior analytics that reveal where and why visitors drop off.
For stores that want to combine behavioral data with outcome metrics—seeing not just that conversions happened, but watching the exact moments that led to them—tools like MIDA offer a direct connection between session replays, heatmaps, and Shopify order data.
Whatever tool you choose, the goal remains the same: turning data into decisions that grow your store.
Try MIDA for free to see how connecting behavior to revenue changes the way you optimize.
FAQs about Shopify analytics apps
Can Shopify analytics apps slow down store performance?
Most modern analytics apps load asynchronously, meaning they don’t block your page from rendering while they collect data. Well-built tools are optimized to avoid impacting page speed or Core Web Vitals scores. That said, it’s worth testing your site speed after installation—some older or poorly optimized tools can add noticeable load time.
What is the difference between behavior analytics and business analytics apps?
Behavior analytics apps show how visitors interact with your store: where they click, how far they scroll, where they hesitate or rage-click. Business analytics apps focus on revenue metrics, profit margins, and attribution—the financial outcomes of visitor behavior. Some tools, like MIDA, combine both approaches so you can connect what visitors do to whether they ultimately purchase.
Do Shopify analytics apps work with headless or custom storefronts?
Compatibility varies significantly. Most analytics apps are built for standard Shopify themes and may not work correctly with headless setups using Hydrogen or custom storefronts. If you’re running a non-standard architecture, look for tools that offer API-based integration or explicitly support headless commerce. Always verify compatibility before committing to a paid plan.
How do Shopify analytics apps track checkout behavior?
Apps with checkout extensibility access can track the full checkout flow, including payment page interactions and form field behavior. However, Shopify restricts checkout access for security reasons, so many tools can only see pre-checkout behavior.
If checkout optimization is a priority, confirm that the app you’re evaluating has the permissions to track the final steps before purchase.
Can analytics data from Shopify apps be exported to external BI tools?
Many analytics apps offer API access, CSV exports, or direct integrations with data warehouses and BI platforms. If your team uses tools like BigQuery, Looker, or Tableau for centralized reporting, check whether the analytics app supports the export methods you want. Some apps include data export in base plans while others reserve it for higher pricing tiers.


