What Is a Mouse Heatmap? Complete Guide with Tools and Examples
A mouse heatmap is a visual overlay that shows where visitors move and hover their cursor on your webpage, using color gradients to represent activity levels—warm colors like red indicate high cursor activity, while cool colors like blue mark areas visitors ignore.
Your analytics tells you 500 people visited your product page, but it can’t explain why 400 of them left without adding anything to cart. Mouse heatmaps reveal what those visitors actually looked at, where they hesitated, and which sections they skipped entirely. This guide covers how mouse heatmaps work, what they reveal about visitor behavior, and which tools help you turn cursor data into conversion improvements.
>> You may also like:
- How to Understand Heatmaps: A Complete Guide
- Heatmap Analysis: 10 Best Practices for Better Insights
What is a mouse heatmap
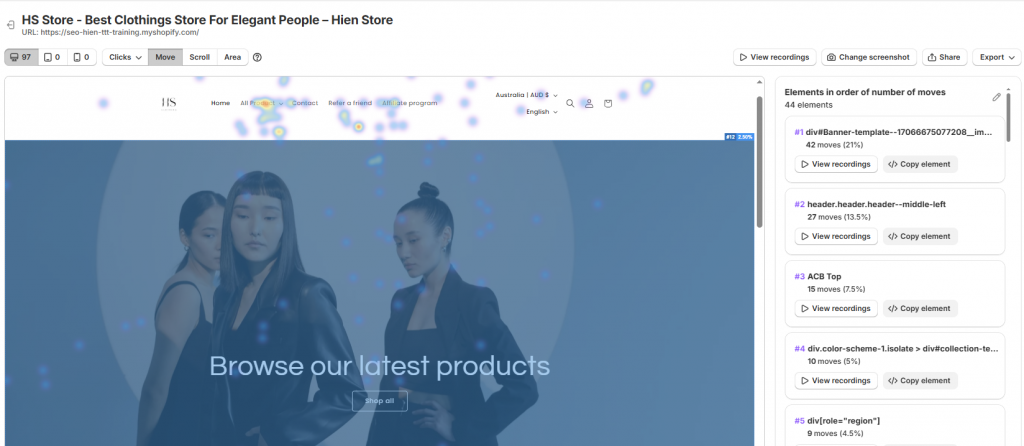
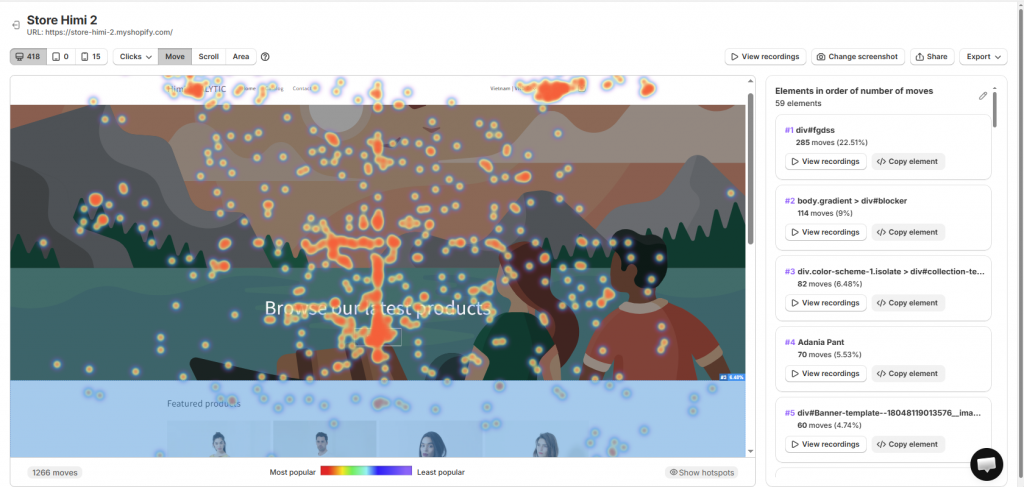
A mouse heatmap (or move map) is a visual overlay that shows where visitors move and hover their cursor on your webpage. Warm colors like red and orange mark areas with heavy cursor activity, while cooler colors like blue indicate zones visitors mostly ignore. Think of it like a thermal camera for your website—except instead of measuring heat, you’re measuring attention.
The idea behind mouse heatmaps is simple: people tend to look where they move their cursor. Your analytics might tell you visitors spend 45 seconds on a product page, but a mouse heatmap reveals they hover repeatedly over your sizing chart without clicking. That pattern suggests confusion or interest worth investigating.
Here’s how the color scale works:
- Red/orange zones: High cursor activity, strong visitor focus
- Yellow/green zones: Moderate activity, some attention but not sustained
- Blue/no color: Little to no cursor movement, often ignored
Why you should use mouse heatmaps on your website
Traditional analytics platforms tell you what happened—200 visitors viewed your product page, 65% bounced. Mouse heatmaps show you what visitors actually did while they were there. Google Analytics reports that people left; a mouse heatmap reveals they hovered over your return policy for 15 seconds before leaving.
Mouse heatmaps connect quantitative metrics to qualitative behavior. You might suspect visitors aren’t noticing your call-to-action button, but you don’t know why. A mouse heatmap can show cursor activity clustering around a decorative image while your CTA sits in a cold zone below.
- Reveal hidden attention patterns: See what draws focus versus what gets skipped
- Validate design decisions: Confirm whether key elements receive the attention you intended
- Identify confusion signals: Spot areas where cursors linger without resulting in action
What mouse heatmaps reveal about visitor behavior
Mouse heatmaps translate raw cursor data into patterns you can act on. The insights go beyond simple hot and cold zones—they reveal specific behaviors that explain why visitors engage or disengage with your content.
Attention zones and hover hotspots
Hover hotspots are areas where many visitors pause their cursor. High cursor activity in certain areas suggests visual interest or content engagement. For example, you might see heavy hover activity on product images while descriptive text below receives almost no cursor movement.
Cursor paths and reading patterns
Tracking cursor movement reveals how visitors scan your page. Some follow an F-pattern, reading across the top then scanning down the left side. Others move in a Z-pattern or jump erratically between elements. If visitors consistently skip from your headline directly to pricing, they might be missing the value proposition that justifies that price.
Interest on non-clickable elements
Visitors often hover over images, icons, or text they expect to be interactive. When you see sustained cursor activity on a static element, it signals an opportunity. If visitors repeatedly hover over a product specification that isn’t linked to more detail, adding that functionality gives them what they’re looking for.
What mouse heatmaps will not tell you
Mouse heatmaps have clear limitations worth understanding upfront. Mouse position doesn’t always equal eye position—experienced users often park their cursor in one spot while their eyes scan elsewhere. The correlation between cursor and gaze is strongest when visitors are actively reading, but it weakens during passive browsing.
- The “why” behind behavior: Heatmaps show where cursors go, not the motivation driving that movement
- Mobile user behavior: Touch devices have no cursor, so mouse heatmaps don’t capture smartphone or tablet interactions
- Intent or emotion: A visitor hovering over your return policy might be reassured or concerned—the heatmap can’t distinguish between the two
For a complete picture, pair mouse heatmaps with session recordings to watch individual journeys and on-site surveys to capture reasoning behind behavior.
Types of mouse heat tracking methods
Mouse heatmaps come in several variations, each capturing slightly different aspects of cursor behavior.
Cursor movement tracking
This method records the full path of the mouse across the page, showing the routes visitors take as they navigate. It’s particularly useful for understanding scanning patterns and how visitors move between different page sections.
Hover tracking
Hover tracking captures where and for how long the cursor pauses. Rather than showing movement paths, it highlights areas of sustained attention—useful for identifying elements that attract prolonged focus.
Attention heatmaps
Attention heatmaps combine movement and time data to weight areas by engagement duration, not just cursor presence. A zone where visitors hover briefly looks different from one where they linger, even if both receive the same number of cursor visits.
Click and scroll integration
Many tools combine mouse movement with click map and scroll map data for a more complete picture. Using multiple heatmap types together—seeing where visitors move, where they click, and how far they scroll—provides richer insight than any single method alone.
How mouse heatmap tracking works
A JavaScript snippet on your site tracks the cursor’s coordinates at set intervals—typically every few milliseconds. This data gets aggregated across many visitor sessions and plotted as a density map using color gradients.
The tracking runs in the background without disrupting the visitor experience. Modern tracking scripts load asynchronously, meaning they don’t block your page content from rendering. You’re not seeing individual cursor movements—you’re seeing patterns that emerge when hundreds or thousands of sessions get layered together.
How to use mouse heatmaps to increase conversions
Once you have mouse heatmap data, the next step is translating patterns into specific improvements.
1. Identify where visitors focus attention
Start by examining the hot zones on your heatmap. Do they align with your most important content? If your value proposition sits in a cold zone while a decorative banner attracts heavy cursor activity, you’ve identified a layout problem worth addressing.
2. Find non-clickable elements getting hover activity
Look for frustration signals where visitors hover over elements expecting an interaction that doesn’t exist. If visitors consistently hover over a product specification icon that isn’t linked to more detail, adding that functionality gives them what they’re looking for.
3. Spot ignored sections and dead zones
Cold zones—areas with no cursor activity—indicate content that visitors skip entirely. Evaluate whether to remove, reposition, or redesign these sections. Sometimes moving important information from a cold zone to a hot zone is all it takes to improve engagement.
4. Segment your maps by device or traffic source
Behavior often differs dramatically by audience segment. Visitors from paid ads might focus on different elements than organic visitors. First-time visitors might scan differently than returning customers. Segmented heatmaps reveal these differences.
Which pages you should track with mouse heatmaps
You don’t need to track every page on your site. Prioritizing high-traffic and high-value pages gives you the most actionable data.
Homepage and landing pages
These pages create first impressions. Mouse heatmaps reveal whether visitors engage with your hero sections and primary CTAs as intended, or whether their attention goes elsewhere.
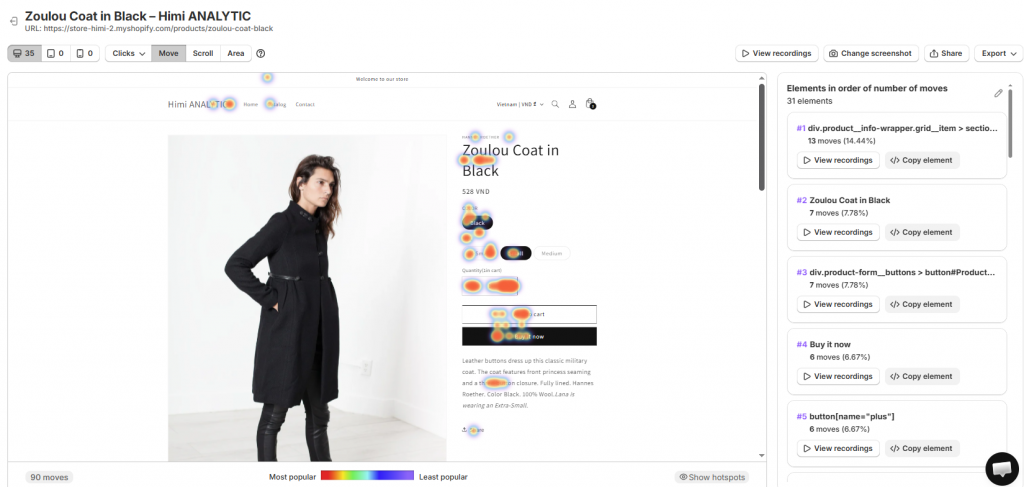
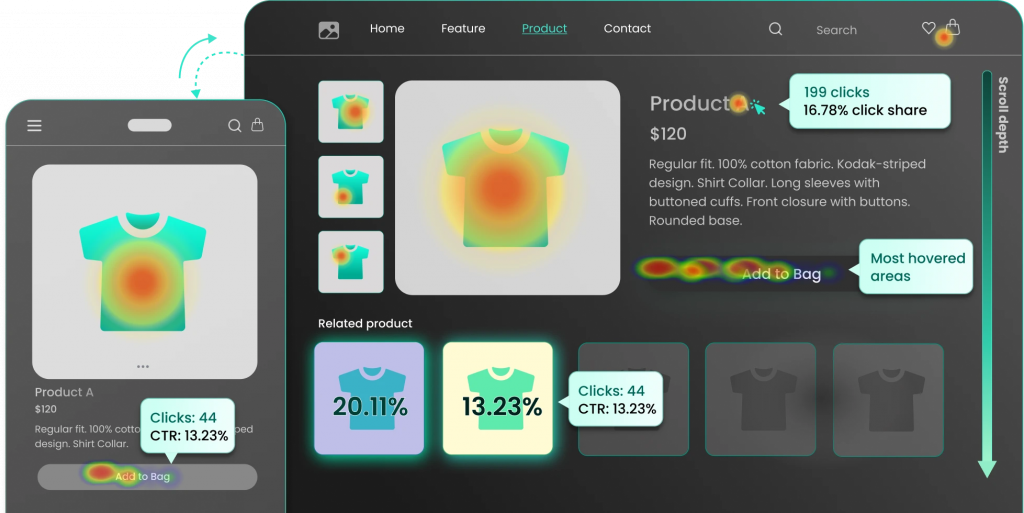
Product and category pages
For ecommerce, these pages drive purchase decisions. Use heatmaps to see whether visitors focus on product images, descriptions, reviews, or add-to-cart buttons—and in what order.
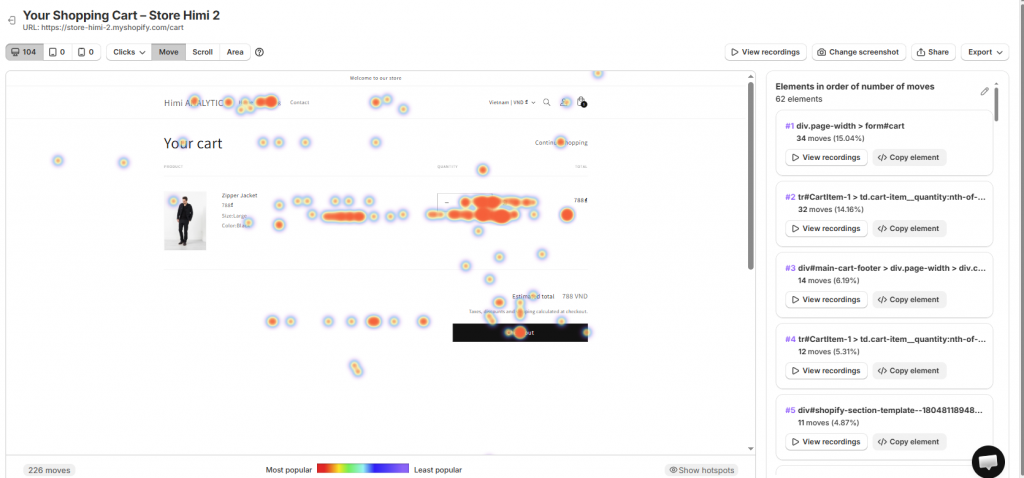
Checkout and cart pages
These high-stakes pages directly impact revenue. Mouse heatmaps can show hesitation around form fields, shipping information, or payment options.
Mouse heatmap vs click heatmap
Click heatmaps show where visitors actually click. Mouse heatmaps show where they move and hover, including non-click behavior.
| Feature | Mouse heatmap | Click heatmap |
| What it tracks | Cursor movement and hover | Actual clicks only |
| Best for | Attention analysis, reading patterns | CTA performance, link popularity |
| Reveals non-click behavior | Yes | No |
Mouse heatmap vs scroll heatmap
Scroll heatmaps show how far down a page visitors travel before leaving. Mouse heatmaps show lateral and vertical cursor movement within the visible area.
The two complement each other: scroll maps reveal depth of engagement, while mouse maps reveal engagement within whatever portion of the page visitors actually see. If your scroll heatmap shows only 30% of visitors reach your product reviews, and your mouse heatmap shows heavy cursor activity on those reviews, you know the content is valuable—it’s just positioned where most visitors never see it.
Mouse heatmap vs session recordings
Session recordings show individual visitor journeys in video format. Mouse heatmaps aggregate behavior across many visitors into a single visualization.
Use heatmaps to identify broad patterns—”visitors consistently hover here but don’t click”—and session recordings to understand the context behind those patterns. You might spot a hot zone on your heatmap, then watch recordings of visitors in that area to see what they were trying to accomplish. Tools like Mida connect these two data types, letting you jump directly from a heatmap insight to the recordings where that behavior occurred.
What metrics you get from mouse heatmaps
Hover duration and frequency
This metric shows how long and how often visitors pause their cursor in specific areas. High duration combined with high frequency is a strong signal of sustained interest.
Cursor path patterns
This is a visual representation of common cursor routes across sessions. It shows whether visitors follow your intended visual hierarchy or take unexpected paths through your content.
Attention distribution scores
Some tools assign numerical scores to different zones based on aggregated mouse activity. These scores are useful for quick comparisons between page versions.
Privacy and compliance for mouse tracking
Reputable mouse tracking tools anonymize data and don’t capture personal information. The tracking records cursor coordinates and page interactions, not names, emails, or payment details.
However, you still want to consider GDPR, CCPA, and other privacy regulations regarding cookie consent and disclosure.
- Disclose tracking in your privacy policy
- Obtain consent where required by your applicable regulations
- Choose tools that anonymize visitor data by default
Best mouse heatmap tools
Mida
Mida offers Shopify-native heatmaps built specifically for ecommerce. It connects mouse behavior to orders, cart activity, and customer profiles—showing not just where visitors hover, but how that behavior relates to revenue outcomes. The platform includes click, movement, and scroll heatmaps with direct links to session replays.
Try Mida free to see mouse heatmaps built for your Shopify store.
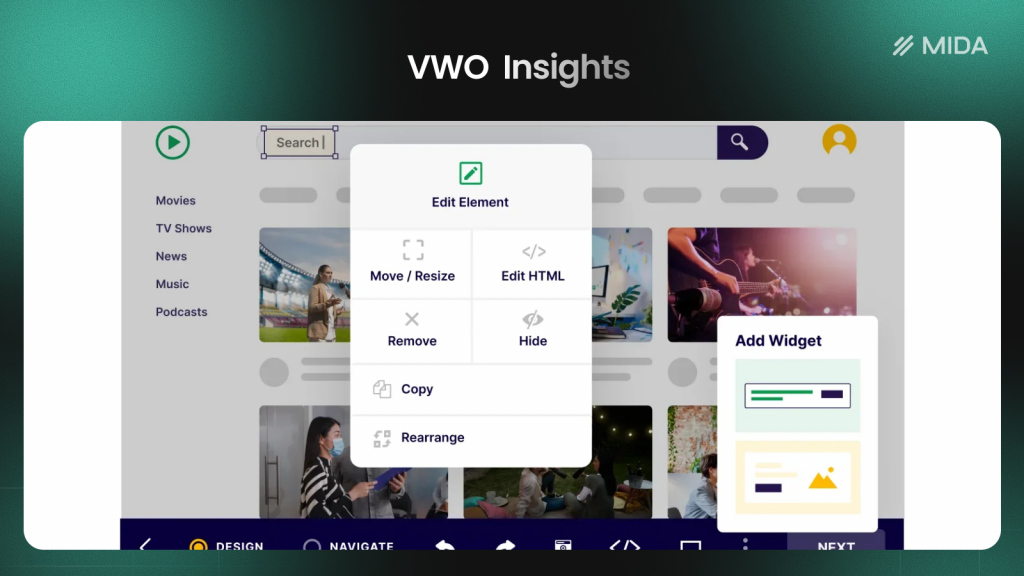
VWO
VWO is an enterprise-grade platform combining heatmaps with A/B testing capabilities. It’s well-suited for larger teams that want experimentation alongside behavior analytics.
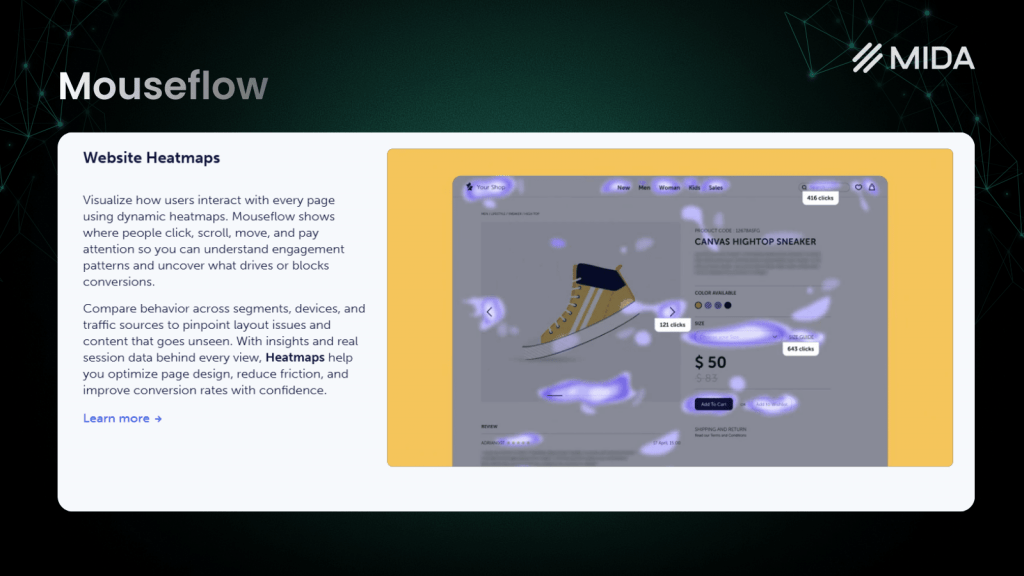
Mouseflow
Mouseflow provides strong movement and attention heatmaps with comprehensive session replay features. It offers six different heatmap types and detailed filtering options.
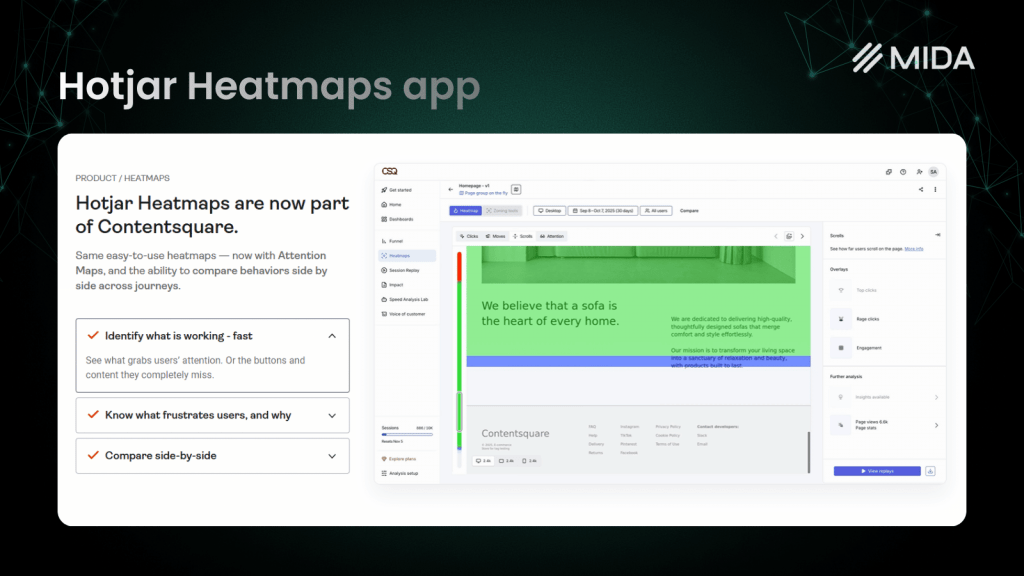
Hotjar
Hotjar is one of the most recognized names in website analytics, offering heatmaps, recordings, and surveys in a familiar interface.
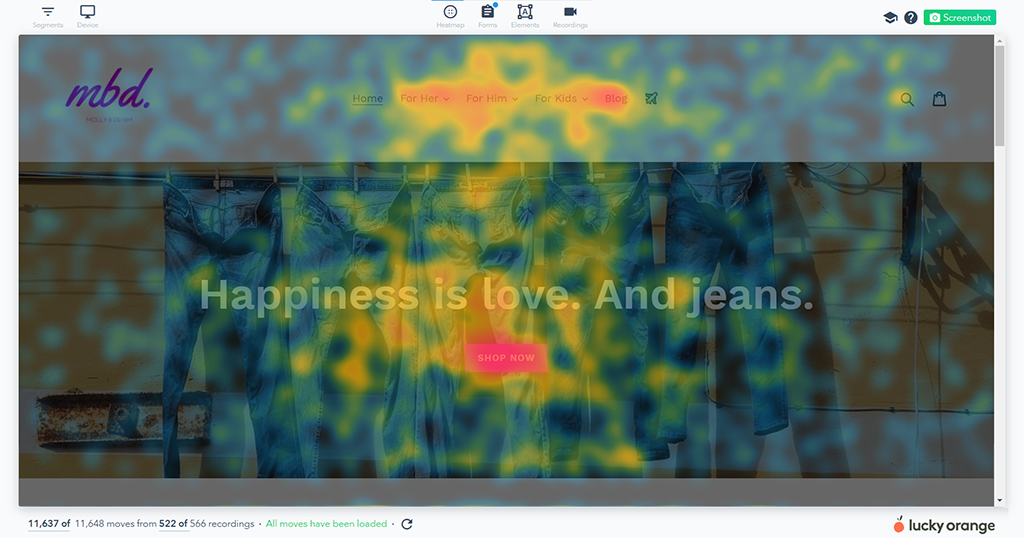
Lucky Orange
Lucky Orange offers real-time heatmaps and session replays with live visitor tracking.
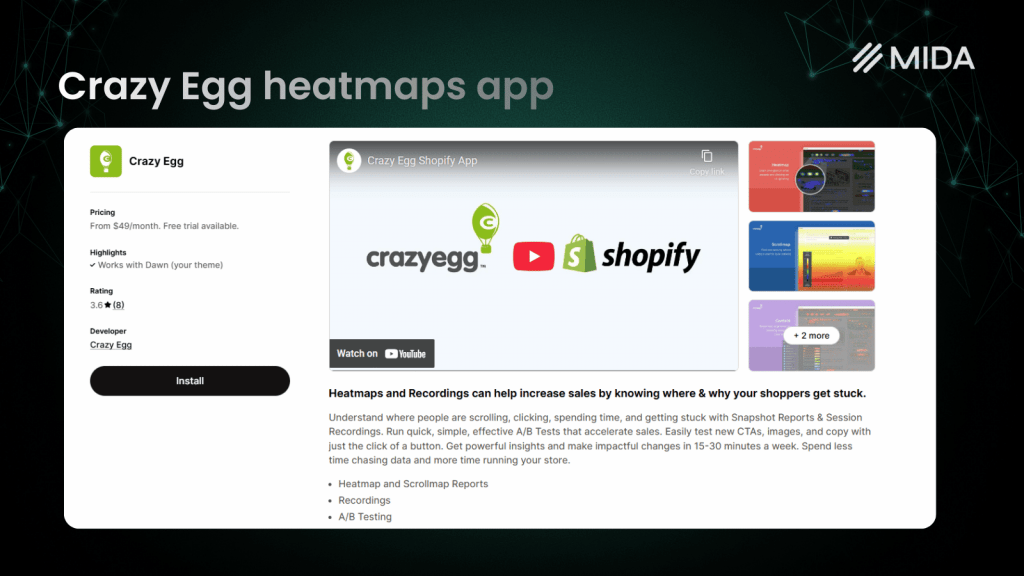
Crazy Egg
Crazy Egg pioneered commercial heatmap tools and maintains a reputation for simplicity.
>> Read more: Best Shopify Heatmap Apps: 12 Tools Tested for Performance in 2026
How to set up mouse tracking on your website
Step 1. Choose a mouse tracking tool
Consider your platform (Shopify, WordPress, custom), budget, and integration requirements. For Shopify stores, native apps that connect directly to your store data provide richer ecommerce context than general analytics platforms.
Step 2. Install the tracking script
Most tools provide a JavaScript snippet or one-click app installation. Shopify apps install automatically without manual code editing.
Step 3. Configure page and segment filters
Set which pages to track first, prioritizing high-value pages like product pages and checkout. Configure segments by device, traffic source, or visitor type.
Step 4. Review and analyze your first heatmaps
Allow enough time for data to accumulate before drawing conclusions—typically 200-300 sessions per page provides reliable patterns. Start by identifying obvious hot zones and cold zones, then dig deeper into specific behaviors.
How mouse heatmaps help Shopify stores convert
For Shopify merchants, mouse heatmaps become especially powerful when connected to commerce outcomes. You can see whether visitors who hover on product images convert differently than those who don’t, or whether cursor activity on your sizing chart correlates with returns.
Tools like Mida tie mouse behavior directly to cart activity and order data, eliminating guesswork about what drives purchases. Instead of debating whether to move your add-to-cart button, you watch how visitors interact with your current layout and see where their attention actually goes.
Turn cursor behavior into revenue clarity
Mouse heatmaps reveal what visitors focus on before they click, giving you evidence to optimize your site instead of acting on assumptions. For Shopify merchants, connecting this behavior to revenue data turns insight into profitable action.
Try Mida free to see mouse heatmaps built for your Shopify store.
FAQs about mouse heatmaps
How accurate is mouse movement as a proxy for eye tracking?
Mouse movement often correlates with eye position, especially when visitors are actively reading or scanning content. However, it’s not a perfect substitute for true eye-tracking studies. Some users park their cursor in one spot while their eyes move elsewhere. Use mouse heatmaps as a practical, accessible alternative rather than expecting precise gaze measurement.
How many visitor sessions do you need for reliable mouse heatmap data?
You generally want enough sessions to see consistent patterns emerge rather than outlier behavior. Most tools recommend 200-300 sessions per page as a minimum threshold. Wait until your heatmap stabilizes—when new sessions stop significantly changing the pattern—before making design changes based on the data.
Does mouse tracking slow down website performance?
Reputable tracking tools use lightweight, asynchronous scripts that load in the background without affecting your page speed or visitor experience.
Do mouse heatmaps work on mobile devices?
Mouse heatmaps rely on cursor movement and don’t apply to touchscreen devices where there’s no cursor. To analyze mobile visitor behavior, use tap heatmaps or session recordings instead.
Can you connect mouse heatmap data to revenue and orders?
Yes, some ecommerce-focused tools like Mida allow you to link cursor behavior to cart activity and completed orders. This connection lets you see how engagement patterns differ between buyers and non-buyers.


