Mida vs Heatmap.com: Which Tool Delivers Better Results for Shopify Merchants?
When you’re trying to understand why shoppers abandon carts or where your checkout flow breaks down, you need more than page view counts—you need to see actual behavior. Both Mida and Heatmap.com promise to show you how visitors interact with your store through session recordings and heatmaps, but the tools take fundamentally different approaches to ecommerce optimization.
Heatmap.com is a general behavioral analytics platform serving diverse industries—from restaurants tracking online ordering flows to B2B SaaS companies analyzing lead generation funnels. Mida, by contrast, is built exclusively for Shopify merchants, with every feature designed around the specific behaviors, events, and outcomes that matter in ecommerce: add-to-cart actions, checkout abandonment, order completion, and revenue attribution.
This comparison examines both platforms across features, usability, pricing, support, integrations, and how well each addresses the real pain points Shopify merchants face when optimizing their stores. If you’re deciding which tool will actually help you reduce cart abandonment and increase conversions, here’s what you need to know.
Key Features and Capabilities
Shopify-Native Commerce Context vs. Generic Behavioral Tracking
The most significant difference between Mida and Heatmap.com lies in how deeply each tool understands ecommerce behavior. Heatmap.com users consistently praise the platform for providing “visual behavioral insights that explain ‘why’ users drop off” and for revenue attribution capabilities that link behavior to sales outcomes. These are valuable features—but they’re built for a general audience spanning restaurants, B2B portals, and retail sites.
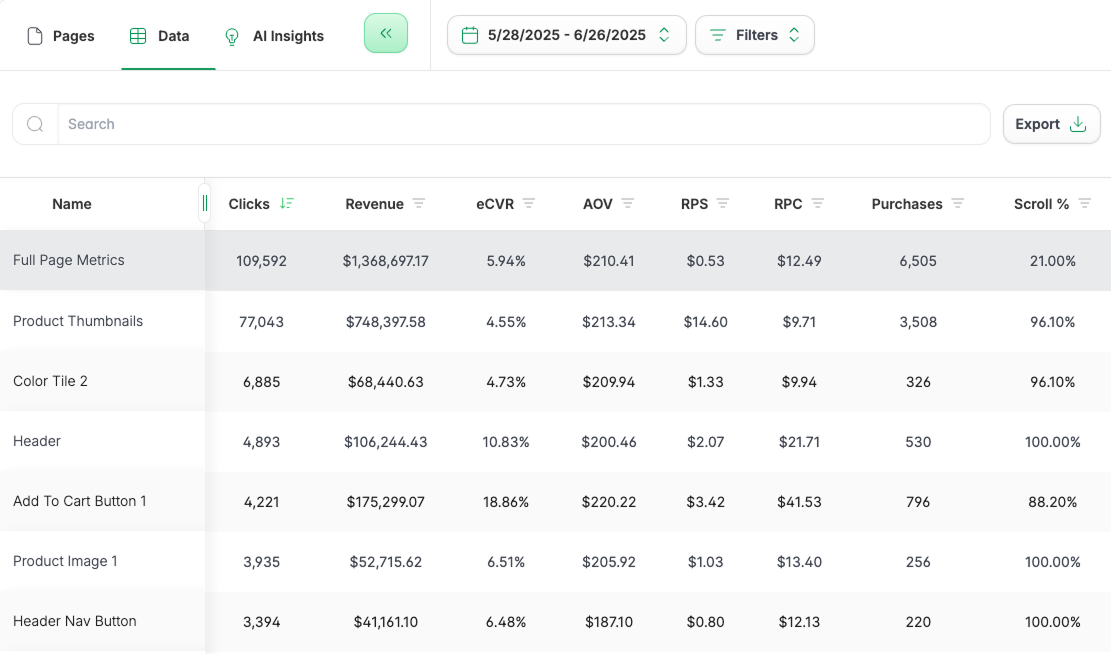
Heatmap Data Table
Mida goes further by embedding Shopify-specific commerce context into every recording and heatmap. When you watch a session in Mida, you see not just clicks and scrolls, but the customer profile, cart value, checkout events, and whether the session resulted in an order. You can filter recordings by abandoned checkout, first-time vs. returning customers, and cart value ranges—segmentation that Heatmap.com users specifically identify as missing. One Heatmap.com reviewer noted they “cannot easily filter for specific traffic sources or customer value” in session recordings, forcing “a lot of manual sifting” to find relevant insights.
With Mida, that manual work disappears. You can instantly pull up all sessions where shoppers abandoned checkout after seeing shipping costs, or watch only high-value cart abandonments from paid ad traffic. This isn’t just convenience—it’s the difference between spending hours hunting for patterns and immediately seeing the friction points that cost you revenue.
Checkout Visibility: Where Most Tools Go Dark
Here’s where general analytics tools hit a wall: Shopify checkout happens on a separate domain, outside the reach of most session recording platforms. Heatmap.com users don’t mention checkout-specific tracking in their reviews, which suggests the platform treats checkout as a black box—you see traffic enter, and you see (or don’t see) orders come out, but the critical moments in between remain invisible.
Mida records checkout sessions natively, capturing the exact interactions, form fills, hesitations, and abandonment triggers that happen during the final purchase step. You can see when shoppers pause at unexpected shipping costs, struggle with address validation, or abandon after encountering payment errors. This visibility is essential because checkout abandonment is where most revenue loss happens—and it’s precisely where most tools leave you guessing.
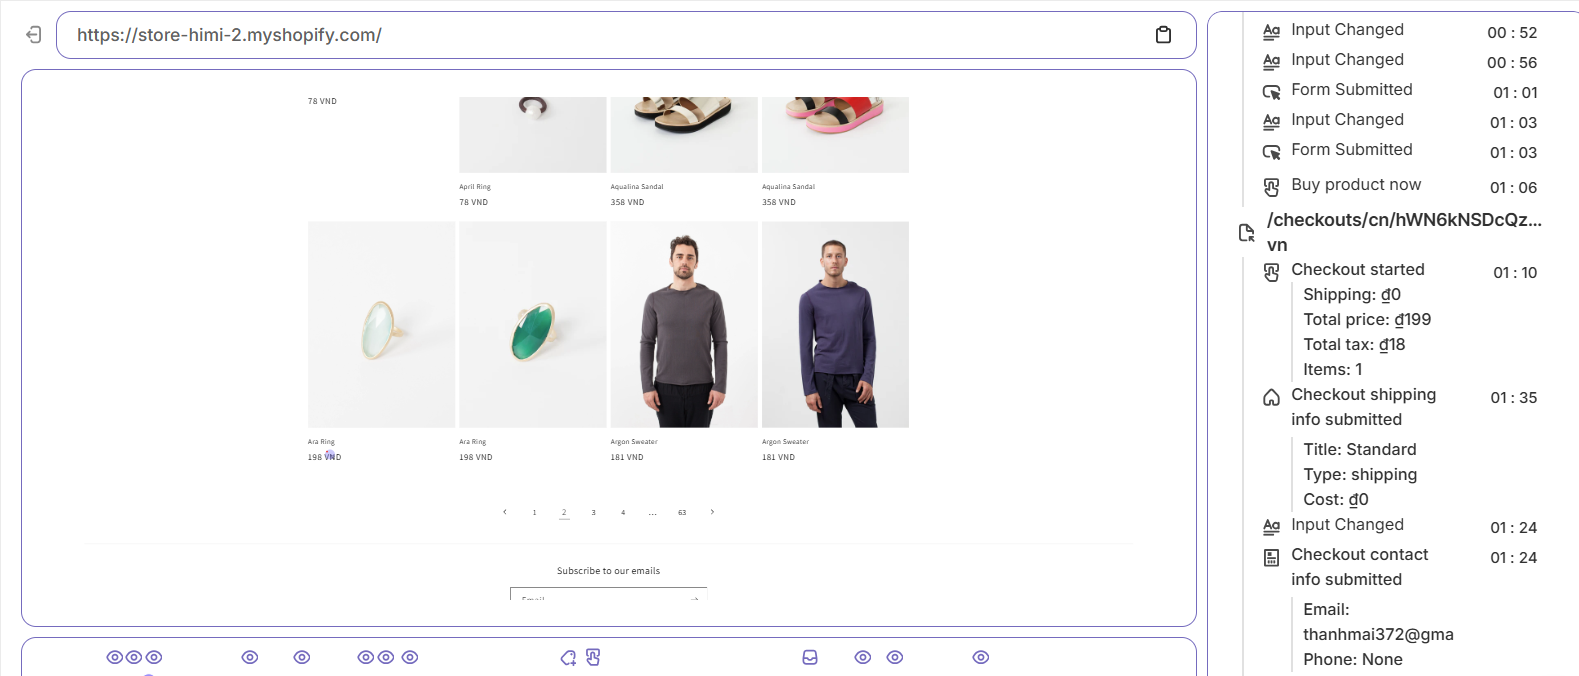
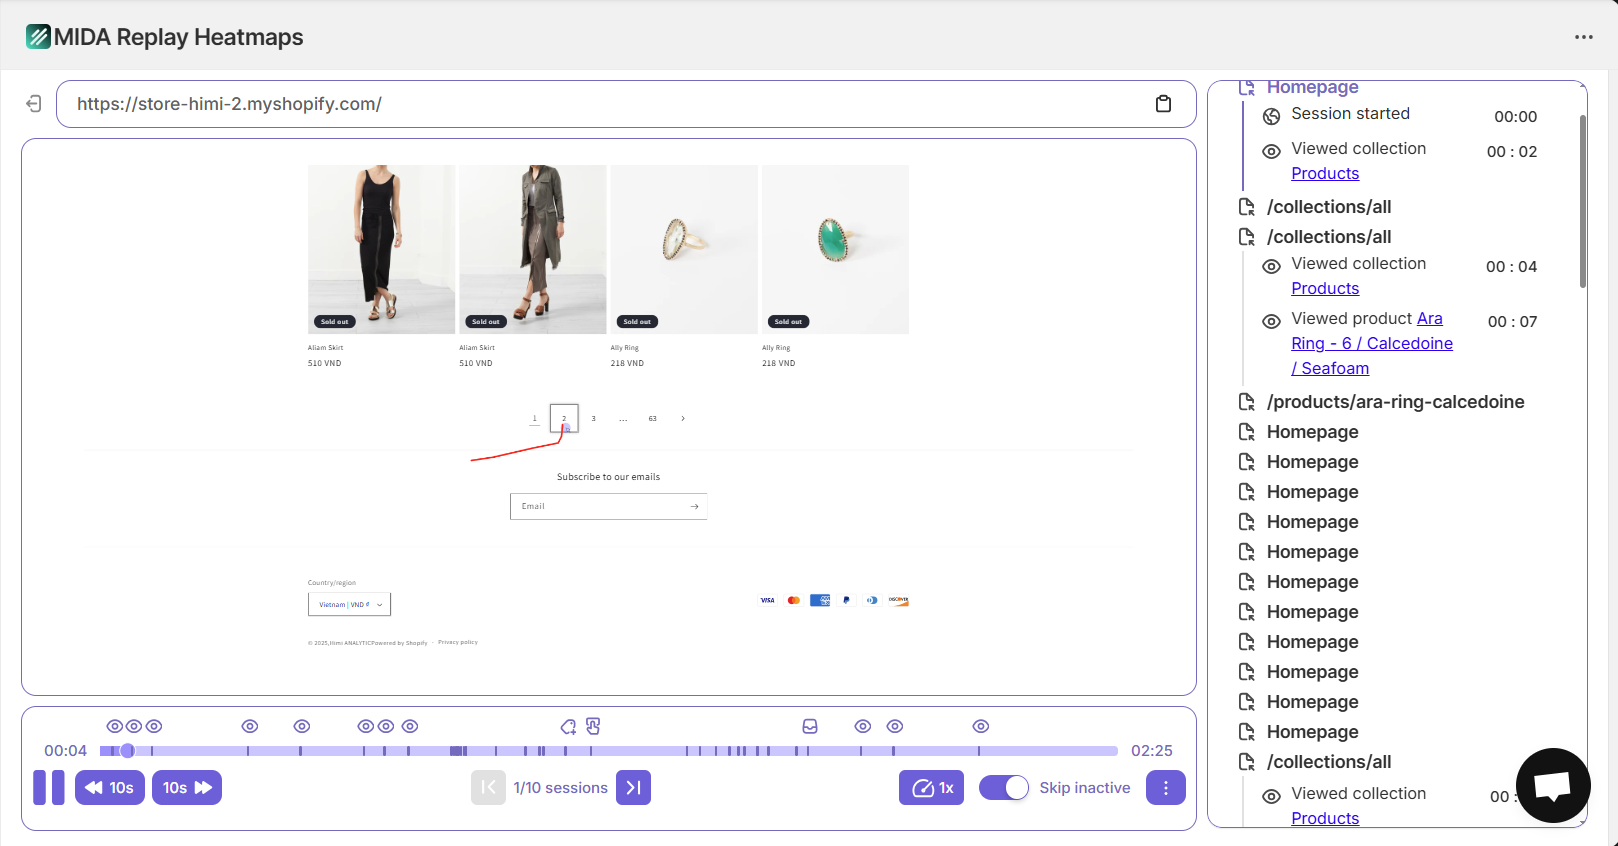
MIDA checkout recording
Element-Level Behavior Analysis
Both platforms offer heatmaps showing where users click and scroll, but Mida adds granular element-level tracking that reveals friction most tools miss. Mida automatically captures rage clicks (repeated frustrated clicks on non-responsive elements), dead clicks (clicks on elements that should be interactive but aren’t), and error clicks (interactions that trigger JavaScript errors).
Heatmap.com users mention click maps that identify “dead clicks and elements users expect to be interactive,” but several reviewers note a “learning curve for advanced features like confetti reports” and difficulty with “blocking/tagging configurations.” Mida’s element-level tracking works automatically—no configuration required. When you see a rage click cluster on your product page, you can click directly into the session recording to watch exactly what frustrated that shopper, then fix the element causing the problem.
Integrated Funnel and Revenue Analytics
Heatmap.com users value the platform’s ability to show “revenue-based heatmaps and revenue attribution that link customer behavior directly to sales outcomes.” This is a strong feature—but it exists somewhat separately from the broader analytics context merchants need.
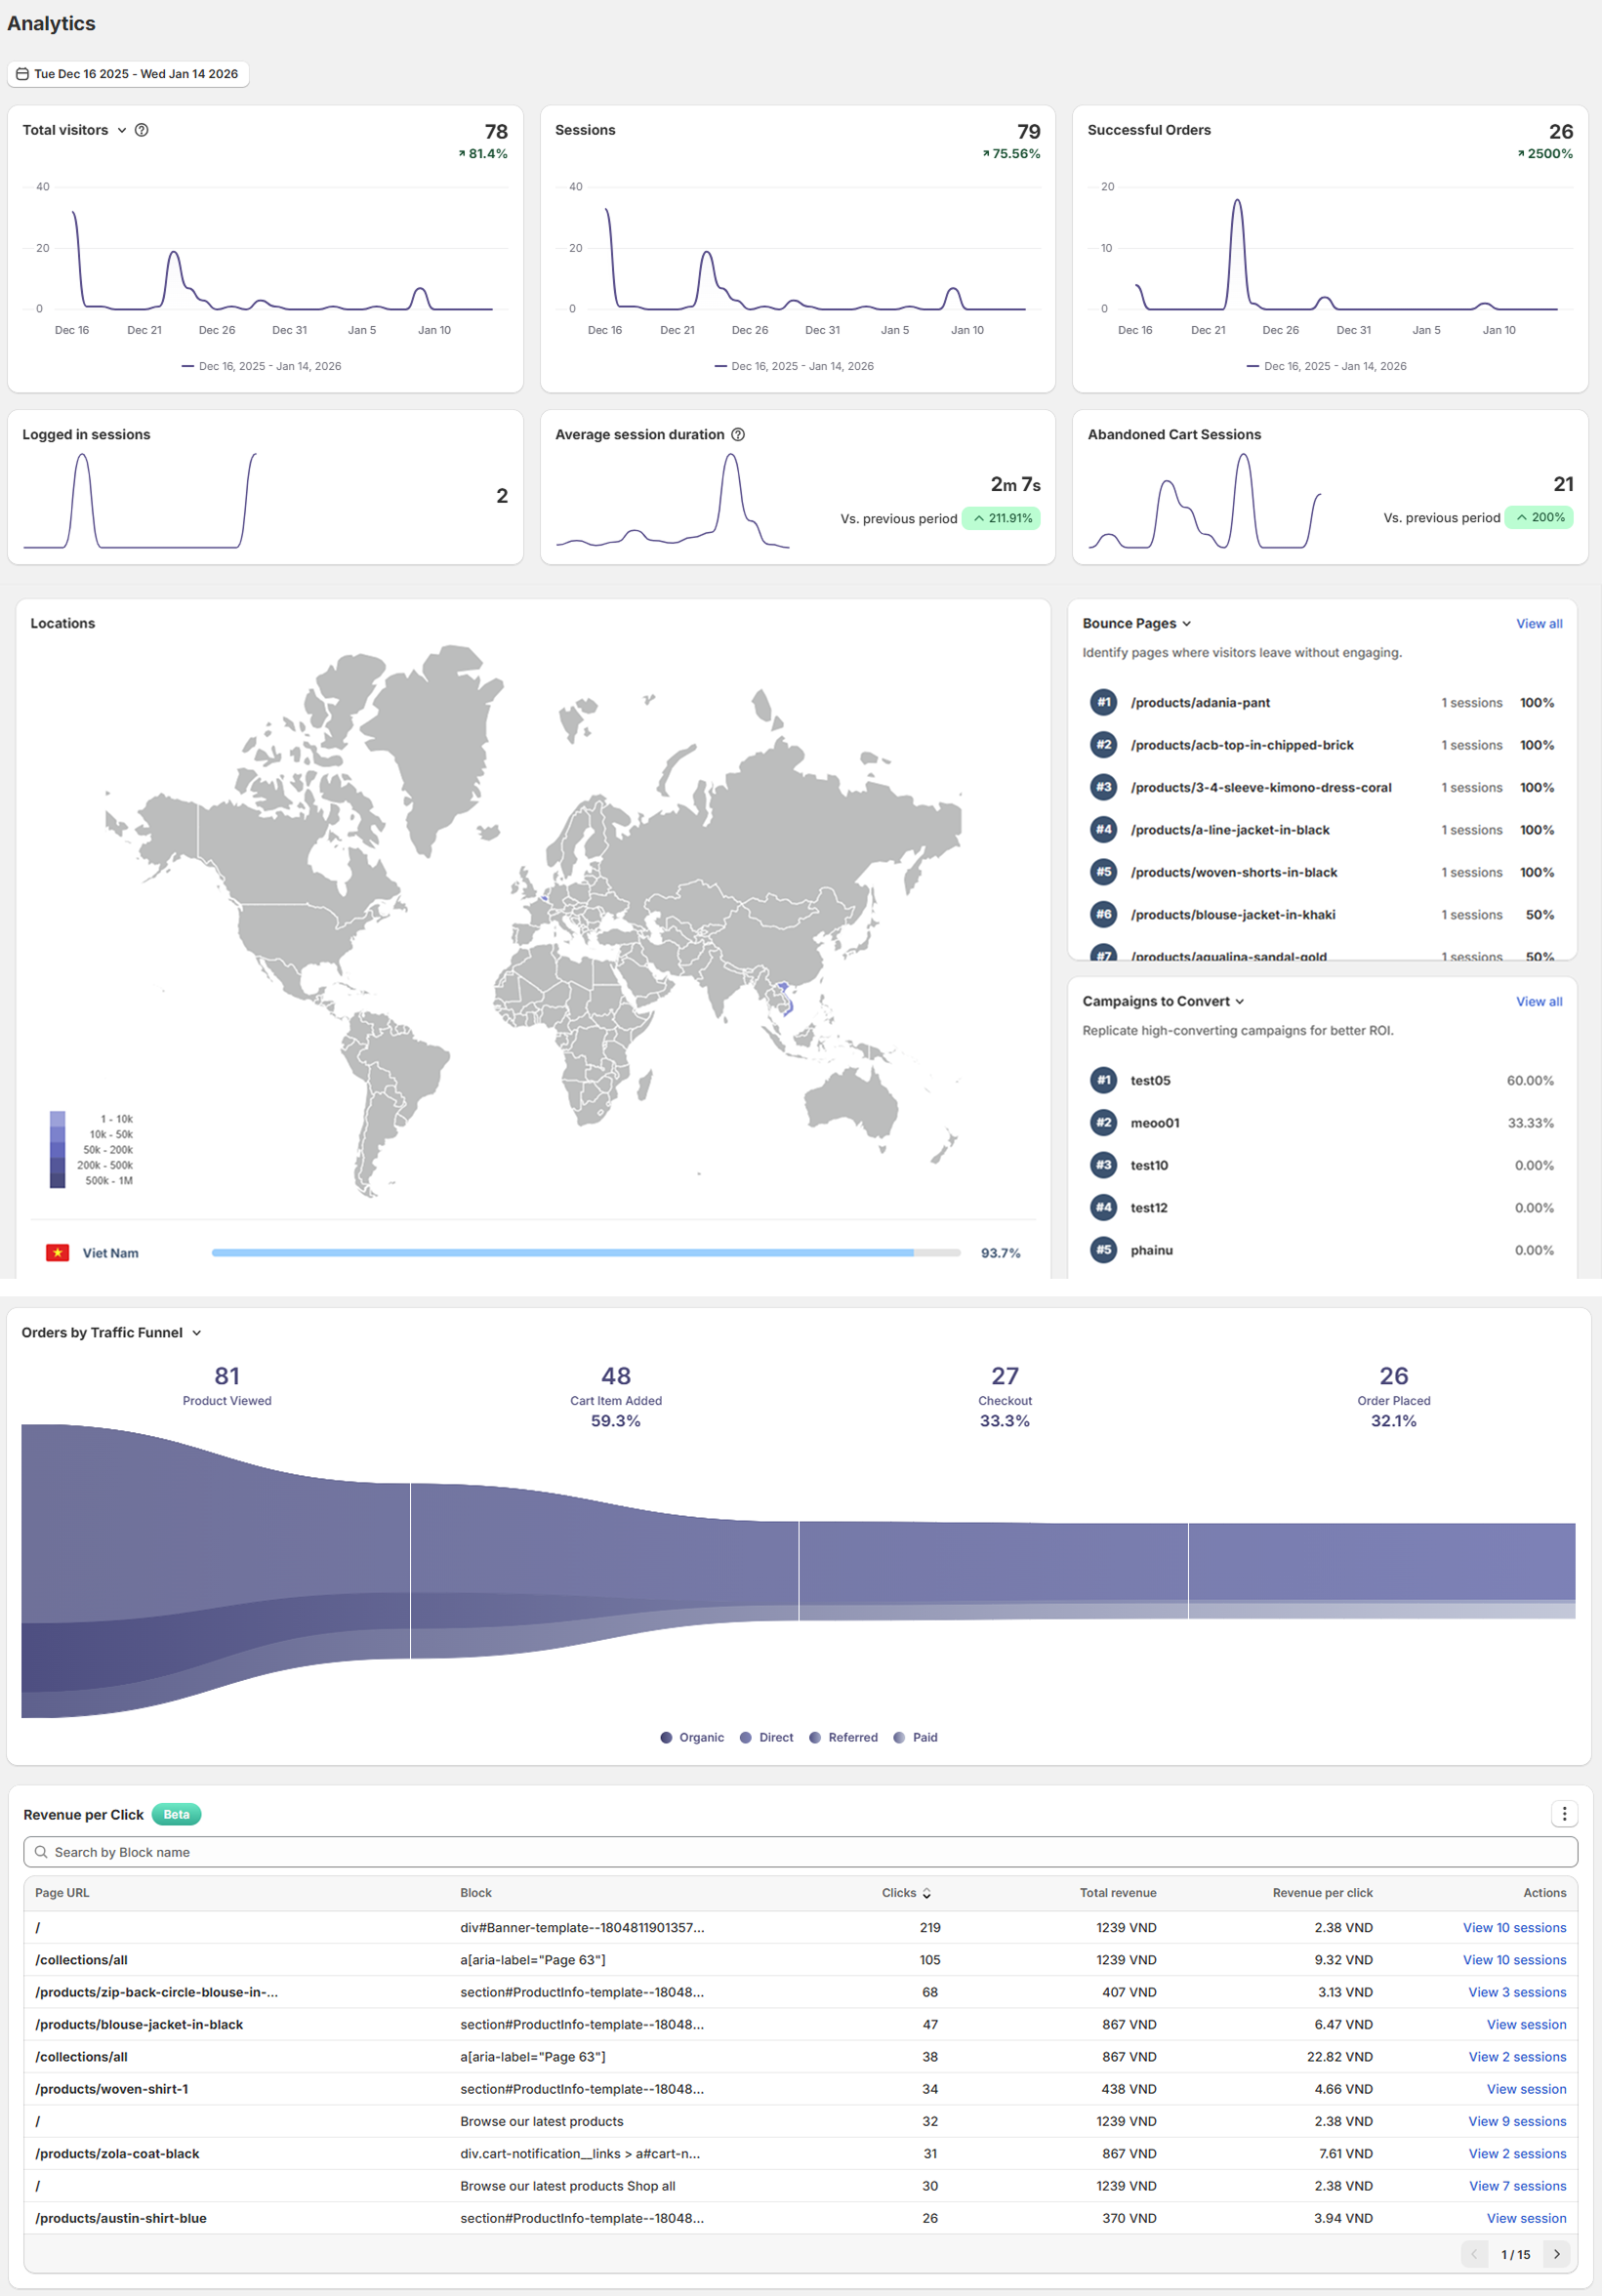
Mida combines behavior tracking with a full Ecommerce Analytics Dashboard that shows visitors, sessions, successful orders, top pages, and device breakdowns in a single Shopify-aware view. The Order Funnel Visualization shows drop-offs from product view to add-to-cart to checkout to completed order, so you know exactly which step to optimize first. When you spot a drop-off, you can filter session recordings to that specific funnel stage and watch what’s causing shoppers to leave. This integrated approach means you’re not switching between tools or trying to manually correlate data from different sources.
User Experience and Ease of Use
Implementation Speed and Store Performance
Heatmap.com users consistently praise “fast, simple implementation with one-line snippet” and report being “operational within 1 hour to 1 day.” This is genuinely fast for a general analytics platform.
Mida matches that speed while adding Shopify-specific advantages. Because Mida is built exclusively for Shopify, installation happens through the Shopify App Store with automatic script injection—no manual code editing required. More importantly, Mida is optimized to avoid impacting your store’s speed score, a critical consideration since page speed directly affects conversion rates and SEO rankings. The lightweight implementation means you get comprehensive behavior tracking without the performance penalty that can come from adding third-party scripts.
Finding the Sessions That Matter
One of the most common frustrations with session recording tools is volume: you capture hundreds or thousands of sessions, but which ones should you actually watch? Heatmap.com users specifically identify “limited advanced segmentation options” as a weakness, noting they “cannot easily filter by traffic source, customer value/LTV, or campaign without manual work.” This forces teams to do “a lot of manual sifting through session recordings to find relevant insights.”
Mida solves this with its Relevance Score system and advanced filtering. Every session gets a relevance score based on behaviors that typically indicate friction or opportunity: cart abandonment, checkout abandonment, rage clicks, error clicks, high engagement, and conversion events. You can sort by relevance to immediately surface the most important sessions, then apply filters for cart value, customer type, traffic source, device, specific pages visited, or custom events.
Even better, Mida lets you save filter combinations as reusable Views. Create a “High-Value Checkout Abandonment” view once, and you can return to it daily to monitor your most costly friction point without rebuilding filters. This transforms session replay from an occasional deep-dive into a daily operational tool.
Interface Clarity for Non-Analysts
Heatmap.com users appreciate the “intuitive interface requiring no data science expertise” and note “you don’t need to be a data scientist to understand” the insights. This accessibility is valuable, particularly for small teams without dedicated analysts.
Mida takes the same approach but tailors it specifically to ecommerce decisions. When you’re looking at a heatmap, you see not just click density but also element-level CTR (click-through rate) and the connection to revenue outcomes. When you’re watching a session, you see the customer’s cart value, order status, and checkout events in the timeline. The interface is designed around the questions Shopify merchants actually ask: “Why did this high-value cart abandon?” “What’s causing the drop-off on my product page?” “Are mobile users experiencing different friction than desktop users?”
This focus means you spend less time interpreting data and more time acting on it. You’re not looking at generic “User 47382 clicked here”—you’re seeing “Returning customer with $247 cart abandoned at shipping step after 3 rage clicks on shipping calculator.”
Pricing and Value
Transparent, Shopify-Aligned Pricing
Heatmap.com users mention pricing as a consideration, particularly noting that the “pricing model is geared toward traditional retail” and includes features that non-retail businesses “don’t need,” which increases costs. One restaurant operator specifically called out paying for unused features, while a B2B SaaS reviewer mentioned “pricing is also a factor to consider, especially for very small SaaS startups.”
The core issue isn’t that Heatmap.com is expensive—users generally acknowledge ROI justifies the investment—but rather that the pricing packages aren’t optimized for specific use cases. You may be paying for capabilities you don’t need because the platform serves such diverse industries.
Mida’s pricing is built specifically for Shopify stores, with tiers based on session volume and features that actually matter to ecommerce merchants. The platform offers a generous free plan that includes session recordings, heatmaps, and basic analytics—enough for new stores to get meaningful insights without any investment. As you scale, paid tiers add advanced features like checkout recording, unlimited heatmaps, and priority support, with pricing that aligns with typical Shopify store growth patterns.
Because every feature is designed for ecommerce, you’re not paying for capabilities built for restaurants, B2B portals, or other verticals. Every dollar goes toward features that directly help you understand and optimize the shopper journey from landing page to completed order.
Measurable ROI for Ecommerce
Heatmap.com users report impressive results: conversion lifts of 15-34%, lead increases of 25-30%, AOV gains of 19%, and ROAS improvements of 41%. These outcomes demonstrate real value—but they span diverse industries and use cases, making it harder to predict what a Shopify merchant specifically might achieve.
Mida’s focus on ecommerce means the insights you gain translate directly to the metrics that matter for your store: cart abandonment rate, checkout completion rate, average order value, and revenue per session. When you identify and fix a checkout friction point, you immediately see the impact in completed orders. When you optimize a product page based on scroll depth and click patterns, you see it in add-to-cart rate. The tight connection between insight and outcome makes ROI measurement straightforward.
Customer Support
Ecommerce Expertise vs. General Support
Heatmap.com users note that “customer support response times vary during peak seasons” and that the “knowledge base needs expansion for self-serve troubleshooting.” Several reviewers mention needing to involve developers for custom integrations or advanced configurations, and one noted that “onboarding lacks guided workflows” for standardizing usage across teams.
The challenge with a platform serving multiple industries is that support teams must understand diverse use cases—restaurant ordering flows, B2B lead generation, wholesale portals, and retail ecommerce. This breadth can dilute the depth of ecommerce-specific expertise.
Mida’s support team focuses exclusively on Shopify merchants, which means they understand your specific challenges: checkout abandonment, cart recovery, product page optimization, mobile commerce friction, and how Shopify’s architecture affects tracking and analytics. When you ask “Why am I seeing high abandonment at the shipping step?” the support team doesn’t need context about your industry—they’ve seen this pattern across hundreds of Shopify stores and can point you to specific elements to check and proven optimization approaches.
Mida also provides AI-Powered Weekly Email Reports that proactively surface insights about your shop health score, abandoned carts, user engagement levels, traffic patterns, and performance trends. This automated guidance means you’re not solely reliant on reactive support—you’re getting ongoing, personalized recommendations based on your store’s actual behavior data.
Integration Capabilities
Native Shopify Integration vs. Generic Platform Connections
Heatmap.com users identify “lack of native CRM integrations (HubSpot, Salesforce) to link session data with leads” as a significant gap, noting that connecting to these systems “currently requires developer resources.” Users also mention “difficulty correlating heatmap data with backend systems (order sizes, POS data, offline sales)” and that linking to POS systems “presented a technical challenge” requiring corporate IT involvement.
These integration challenges stem from Heatmap.com’s position as a general platform that must support countless potential integrations across different industries. Building and maintaining deep, native connections to every possible system isn’t feasible, so users often need custom development work to connect behavioral data with their broader tech stack.
Mida takes a different approach: deep, native integration with Shopify itself. Because Mida is built exclusively for Shopify, it automatically connects to your customer data, order data, product catalog, checkout events, and cart information. You don’t need to configure custom events to track add-to-cart actions or set up special tagging for checkout steps—Mida understands these Shopify-native events automatically.
This native integration means session recordings are automatically enriched with customer profiles (new vs. returning, order history, customer tags), cart context (products, quantities, values), and order outcomes (completed, abandoned, refunded). When you’re watching a session, you see the full Shopify context without manual setup or custom development.
For merchants who do need connections beyond Shopify—email marketing platforms, customer support tools, or analytics warehouses—Mida integrates smoothly with the Shopify ecosystem tools most merchants already use. The difference is that the core ecommerce data you need is built-in, not bolted on.
Cross-Device and Campaign Attribution
Heatmap.com users praise “geographic filtering for local marketing insights” and mention smooth integration with Google Tag Manager, but several note they “cannot easily filter for specific traffic sources or customer value” and struggle with campaign-level analysis.
Mida provides built-in UTM parameter tracking and campaign attribution, letting you filter sessions by traffic source, campaign, ad group, or keyword. This means you can watch exactly how traffic from a specific Facebook ad behaves differently from Google Shopping traffic, or see whether your email campaign subscribers are experiencing different friction than organic visitors.
The cross-device analysis in Mida’s heatmaps shows you how mobile, tablet, and desktop users interact differently with the same page—critical insight since mobile commerce behavior often differs significantly from desktop. You can see that desktop users scroll past your product description while mobile users never reach it, or that tablet users struggle with a checkout form that works fine on other devices.
Addressing Specific Pain Points
Segmentation and Filtering: From Manual Sifting to Instant Insight
The most frequently mentioned weakness in Heatmap.com reviews is “limited advanced segmentation options” that force users to do “a lot of manual sifting through session recordings.” Users specifically want to filter by traffic source, customer value, campaign, and behavioral signals—but these capabilities either don’t exist or require workarounds.
This isn’t a minor inconvenience. When you’re trying to understand why your paid traffic isn’t converting, you need to isolate sessions from that traffic source and watch them. When you’re optimizing for high-value customers, you need to see how shoppers with large carts behave differently. Without these filters, you’re either watching hundreds of irrelevant sessions or making optimization decisions based on small, manually-selected samples that may not represent the real pattern.
Mida’s advanced filtering eliminates this problem entirely. You can filter sessions by:
- Customer type: New visitors, returning customers, customers with previous orders, customers with specific tags
- Cart and order context: Cart value ranges, abandoned cart, abandoned checkout, completed orders, specific products in cart
- Traffic source: Direct, organic search, paid ads, email, social, specific campaigns or keywords
- Behavioral signals: Rage clicks, dead clicks, error clicks, high engagement, specific page visits, form interactions
- Device and location: Mobile, tablet, desktop, specific countries or regions
- Custom events: Any Shopify event or custom trigger you define
You can combine these filters to create highly specific views: “Show me mobile sessions from paid Facebook traffic where shoppers with carts over $100 abandoned at checkout.” This precision transforms how quickly you can diagnose and fix problems.
Performance at Scale: Dashboard Speed and Real-Time Monitoring
Several Heatmap.com users mention that the “dashboard tends to load slowly” when multiple high-traffic accounts are open, and that “load times can be sluggish when pulling real-time analytics during high-traffic periods.” For agencies managing multiple clients or operators monitoring live traffic, these performance issues create real friction.
Mida is optimized for performance even with high session volumes. The dashboard loads quickly, heatmaps generate fast, and session playback starts immediately. For merchants running high-traffic promotions or flash sales, this responsiveness means you can monitor behavior in near-real-time and catch issues before they cost significant revenue.
The AI-powered weekly reports also reduce the need for constant dashboard monitoring. Instead of logging in daily to check if anything looks wrong, you receive proactive summaries highlighting changes in shop health, engagement patterns, and friction points. This shifts your workflow from reactive monitoring to strategic optimization.
Collaboration and Sharing: From Individual Analysis to Team Action
Heatmap.com users note that “exporting visualizations requires a few extra clicks” and that “white-labeling options are quite limited,” which “poses a challenge when we need to present insights to agency clients.” These friction points slow down the process of turning insights into action, particularly for teams that need to share findings with developers, designers, or stakeholders.
Mida makes collaboration straightforward. You can share specific session recordings with a direct link, create shareable heatmap views, and export funnel visualizations. When you identify a UX issue, you can send the exact session showing the problem to your developer with full context—no need to write a detailed explanation when they can simply watch what happened.
The survey feedback feature also supports collaboration by giving every team member access to the “why” behind behavior. When a customer explains their frustration in a survey response, anyone on your team can click to watch that customer’s full session, ensuring everyone understands the problem from the customer’s perspective.
Operational Simplicity: One Tool vs. Multiple Platforms
A subtle but significant advantage of Mida is consolidation. With Heatmap.com, you’re getting behavioral analytics—but you likely need separate tools for surveys, funnel analytics, customer segmentation, and ecommerce-specific reporting. Each additional tool adds cost, requires separate logins, and creates integration challenges.
Mida combines session recording, heatmaps, funnel visualization, ecommerce analytics, on-site surveys, and automated reporting in a single Shopify-native platform. This consolidation means:
- One installation instead of multiple script tags potentially conflicting or slowing your site
- One interface to learn instead of switching between tools with different conventions
- Automatic data consistency since everything draws from the same source
- Lower total cost since you’re not paying for multiple subscriptions
- Faster workflows since you’re not exporting from one tool and importing to another
For lean teams—which describes most Shopify merchants—this operational simplicity is a significant advantage. You can move from identifying a problem to understanding its cause to implementing a fix without leaving the platform or coordinating data across systems.
The Verdict: Purpose-Built Wins for Shopify Merchants
Heatmap.com is a capable behavioral analytics platform that serves diverse industries and delivers measurable results. Users consistently praise its visual insights, revenue attribution, and fast implementation. For a restaurant optimizing online ordering or a B2B company analyzing lead generation, it may be an excellent choice.
But if you’re a Shopify merchant trying to reduce cart abandonment, optimize checkout, and increase conversion rates, Mida’s purpose-built approach delivers advantages that a general platform simply can’t match:
- Native Shopify integration that automatically captures customer context, cart data, checkout events, and order outcomes without custom configuration
- Checkout visibility that shows you exactly what happens during the most critical revenue step, where most tools go dark
- Advanced segmentation that eliminates the manual sifting Heatmap.com users identify as a major pain point, letting you instantly filter by customer value, cart status, traffic source, and behavioral signals
- Element-level friction detection with automatic rage click, dead click, and error click tracking that reveals UX problems without configuration
- Integrated surveys and feedback that connect the “what” of behavior with the “why” of customer intent, with direct links from responses to session recordings
- Consolidated platform that combines recording, heatmaps, funnels, analytics, and surveys in one tool instead of requiring multiple subscriptions and integrations
- Ecommerce-focused support from a team that understands Shopify-specific challenges and optimization patterns
The difference isn’t just features—it’s focus. Every element of Mida is designed around the specific behaviors, events, and outcomes that matter for Shopify stores. You’re not adapting a general tool to ecommerce; you’re using a platform built specifically for the problems you’re trying to solve.
When you can see exactly where shoppers hesitate, what causes them to abandon, and which elements drive them toward purchase—all within the context of your Shopify customer and order data—you stop guessing and start optimizing with confidence. That’s the difference between generic behavioral analytics and purpose-built Shopify intelligence.
See Your Store Through Your Customers’ Eyes
Stop guessing why shoppers abandon. Start watching what actually happens on your Shopify store—from first click to completed order.


