How To Optimize Shopify Checkout Using Behavior Analytics (2026)
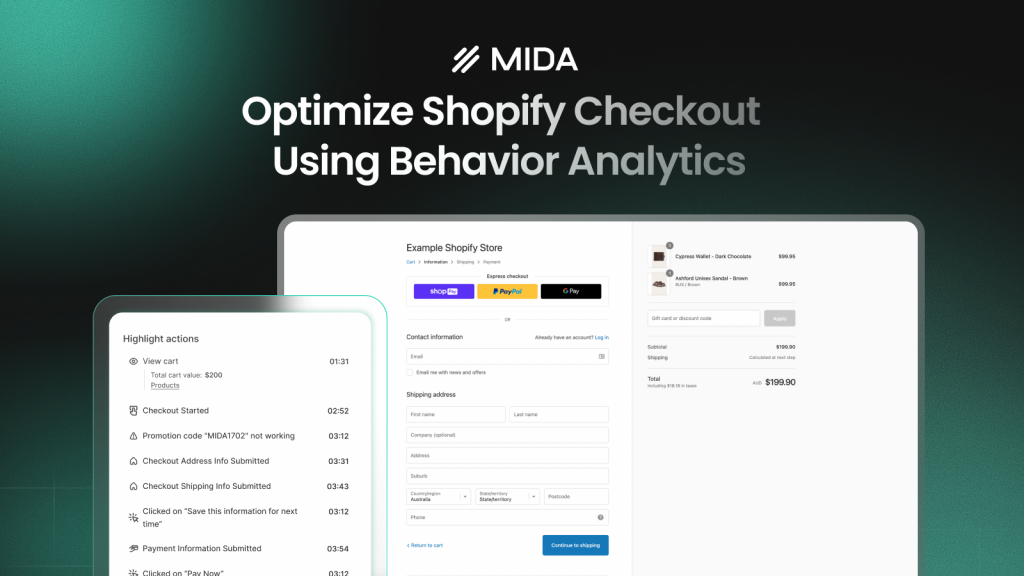
Your Shopify analytics show 70% of shoppers abandon checkout, but the number doesn’t tell you whether they left because of shipping costs, a confusing form field, or a button that didn’t respond. Behavior analytics fills this gap by recording what shoppers actually do—every click, scroll, pause, and rage click—so you can see the exact moment checkout breaks down.
This guide covers how to set up behavior tracking for your Shopify checkout, diagnose friction points using session replays and heatmaps, and turn those observations into fixes that recover lost revenue.
What is behavior analytics for Shopify checkout
Behavior analytics tracks what shoppers actually do on your checkout pages—where they click, how far they scroll, where they pause, and when they leave. Think of it like watching over a shopper’s shoulder as they move through your store, except you’re seeing patterns across hundreds or thousands of sessions.
The difference between behavior analytics and standard Shopify reports comes down to depth. Your Shopify dashboard tells you that 68% of shoppers abandoned checkout last month. Behavior analytics shows you that most of them stopped typing in the phone number field, scrolled up and down three times looking for something, then closed the tab.
The core tools include:
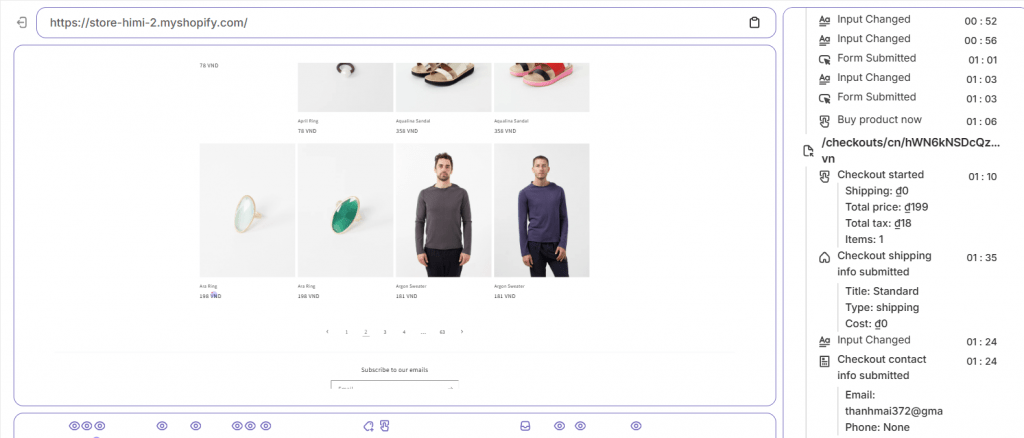
- Session recordings: Video-like playbacks of individual shopping journeys from landing to exit
- Heatmaps: Color-coded overlays showing where clicks and scrolls concentrate across many sessions
- Funnel visualization: Step-by-step tracking of where shoppers drop off between checkout stages
When connected to Shopify-native data like cart value and customer type, behavior tools transform vague metrics into specific, fixable problems.
Why Shopify checkout optimization requires behavior data
Standard analytics creates a visibility gap. You can see that abandonment happened, but you can’t see what triggered it. This forces you into guessing—maybe it’s the shipping cost, maybe it’s the form layout, maybe it’s something else entirely.
Behavior analytics closes this gap by showing you the actual friction. Instead of assuming shoppers left because of price, you watch recordings and discover they repeatedly clicked a non-functional element or scrolled up and down looking for information that wasn’t there.
The checkout is particularly tricky because Shopify’s native reporting treats it as a single step. Behavior tools break it into granular moments—shipping info entry, payment selection, final confirmation—so you can pinpoint exactly where the journey breaks down.
Checkout friction points behavior analytics reveals
Unexpected shipping costs and fee surprises
This friction pattern appears when a shopper moves confidently through product selection and cart review, then suddenly stops or leaves immediately after shipping costs display. In session recordings, you’ll notice a distinct pause—sometimes 10 to 20 seconds of inactivity—followed by either abandonment or frantic scrolling back to the cart.
The behavioral signature is unmistakable: smooth progress, then a hard stop at a specific moment. Heatmaps often show repeated clicks on the shipping cost area as shoppers try to find alternatives or understand the charges.
Complex or confusing form fields
Form friction shows up as repeated typing, backspacing, and tabbing between fields. You might see a shopper enter their phone number three different ways before getting it accepted, or watch them hover over a field label trying to understand what’s being asked.
Rage clicks—rapid, frustrated clicking on the same element—frequently appear on problematic form fields. Address autocomplete and phone number formatting are common culprits, especially when the expected format isn’t clear.
Payment method friction
When shoppers can’t find their preferred payment option or feel uncertain about security, their behavior changes noticeably. They scroll up and down the payment section, hover over security badges, or pause for extended periods before entering card details.
Some shoppers abandon without even attempting to enter payment information. This signals that something about the payment step feels wrong, whether it’s missing options or insufficient trust signals.
Mobile checkout usability issues
Mobile-specific problems include tap targets that are too small, keyboards covering important fields, and layouts that require excessive scrolling. Cross-device heatmap comparison often reveals dramatic differences: a checkout that works smoothly on desktop might show scattered, frustrated taps on mobile.
Session recordings from mobile devices frequently capture shoppers accidentally tapping the wrong button or struggling to see what they’re typing as the on-screen keyboard obscures form fields.
Missing trust signals and security concerns
Trust-related hesitation appears as hovering over security badges, scrolling to the footer to check for policies, or abandoning at the payment step without any interaction. Shoppers who don’t feel secure often exhibit “checking” behavior—looking for reassurance before committing.
If your recordings show multiple shoppers scrolling away from the payment form to look for trust indicators, that’s a clear signal that your security messaging isn’t visible enough at the moment of decision.
Slow load times and technical errors
Technical issues create distinctive behavioral patterns: rage clicks on unresponsive buttons, page refreshes, or repeated attempts to complete the same action. These problems are often invisible in aggregate data but obvious when you watch individual sessions.
Error clicks—attempts to interact with elements that aren’t working—point directly to technical problems that standard analytics would never surface.
How to set up behavior tracking for Shopify checkout
1. Install a Shopify-native behavior analytics app
Shopify-native tools automatically integrate with customer profiles, orders, and checkout events without requiring custom code. This integration matters because it connects behavioral data to commerce outcomes—you can filter sessions by cart value, customer type, or purchase result.
Installation typically takes a few clicks from the Shopify App Store. Tools built specifically for Shopify capture checkout activity automatically and link recordings to order data.
2. Configure checkout event tracking
Define the specific events that create your checkout funnel:
- Checkout initiated
- Shipping info entered
- Payment info entered
- Order completed
These events become the stages you’ll analyze for drop-offs. Most Shopify-native tools capture them automatically, but verify that your checkout pages are being recorded—some generic analytics tools miss checkout activity entirely.
3. Set up customer segmentation filters
Configure segments before you start analyzing so you can compare behavior across different customer types:
- Abandoned checkout vs completed orders: Isolate problem sessions from successful ones
- First-time vs returning customers: Different groups face different friction
- High-value vs low-value carts: Prioritize fixes that impact revenue most
- Traffic source and campaign: Understand how different audiences behave
4. Enable session recording for checkout pages
Confirm that your tool captures checkout page activity and automatically masks payment fields. Privacy compliance requires that sensitive information like card numbers never appears in recordings.
Test the setup by completing a test purchase and reviewing the recording to ensure all checkout steps are captured correctly.
How to diagnose checkout issues with session replay
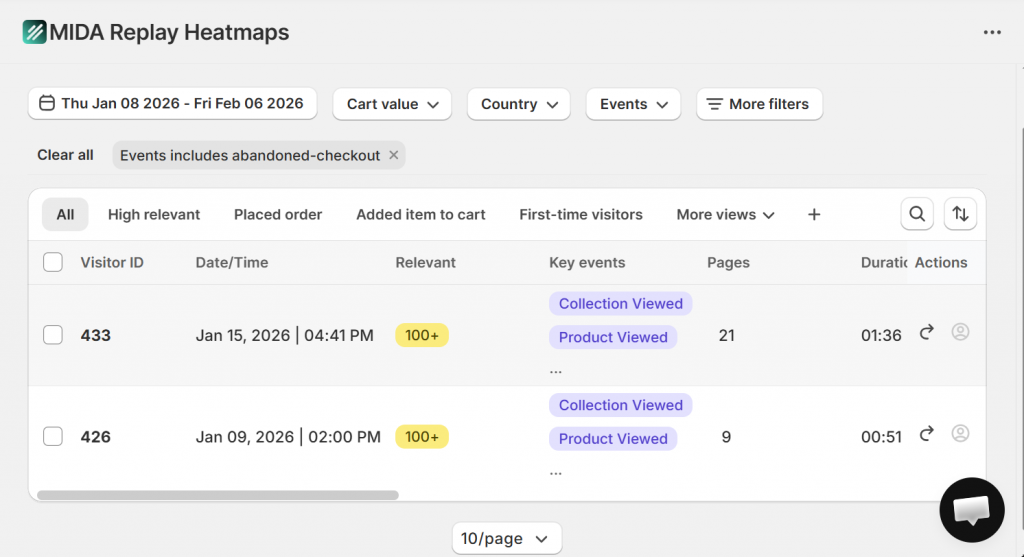
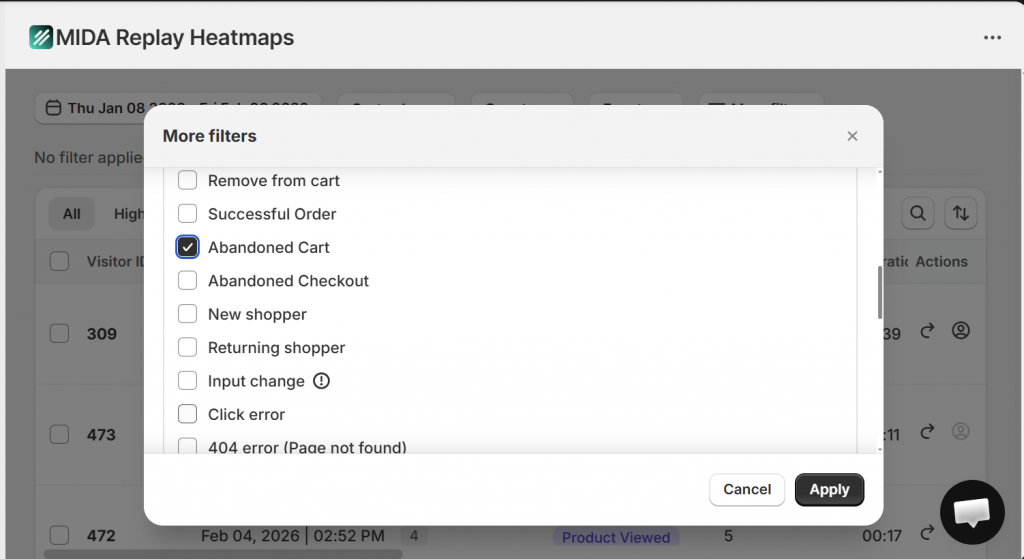
Filter sessions by abandoned checkout
Start by isolating the sessions that matter most. Abandoned checkout filters let you skip successful orders and focus exclusively on shoppers who started checkout but didn’t finish.
This filtering transforms session replay from overwhelming to actionable. Instead of watching hundreds of random sessions, you’re watching only the ones where something went wrong.
Watch high-value cart abandonment sessions
Cart value determines the revenue impact of each fix. A friction point affecting $500 carts matters more than one affecting $20 carts, even if the lower-value issue is more common.
Filter by cart value to prioritize your analysis. Watching high-value abandonment sessions first ensures you’re solving problems that directly impact your bottom line.
Identify rage clicks and hesitation patterns
Rage clicks appear as rapid, repeated clicking on the same element—a clear frustration signal. Hesitation shows up as extended pauses, often 10+ seconds, before an action or abandonment.
Both patterns point to specific problems. Rage clicks indicate something isn’t working as expected, while hesitation suggests confusion or concern about proceeding.
Review mobile vs desktop checkout journeys
The same checkout can behave completely differently across devices. Watch sessions from both mobile and desktop to catch device-specific issues that aggregate data would mask.
Mobile sessions often reveal problems that don’t exist on desktop: buttons too small to tap accurately, forms that don’t work well with touch keyboards, or layouts that hide important information.
How to analyze checkout heatmaps and click data
Click heatmaps for checkout buttons and links
Click heatmaps reveal whether shoppers are clicking the right elements or getting confused by non-clickable items. Warm colors (red, orange) show high-activity zones, while cool colors (blue, green) show ignored areas.
Dead clicks—clicks on elements that don’t do anything—indicate design confusion. If shoppers repeatedly click on a heading or image expecting it to be interactive, that’s a UX problem worth fixing.
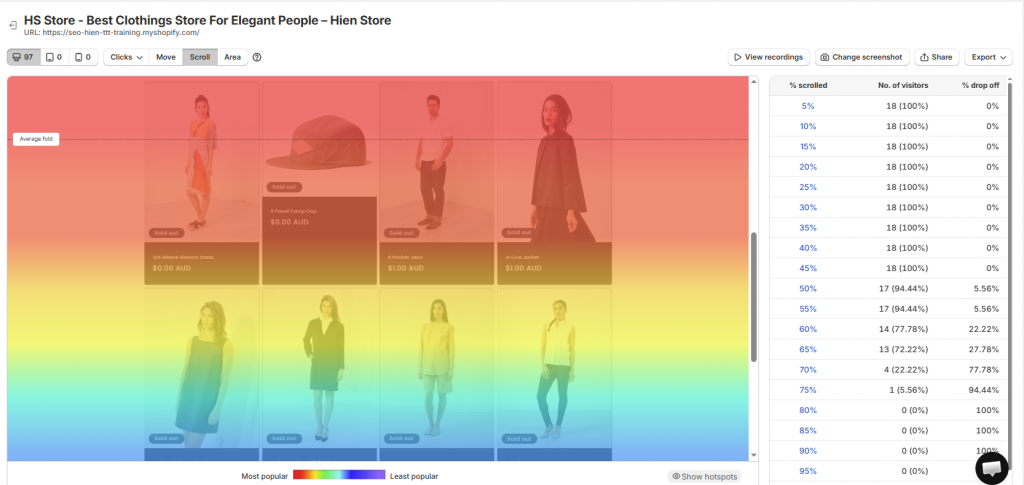
Scroll depth analysis for checkout pages
Scroll heatmaps show what percentage of shoppers see each section of your checkout. If critical information like shipping costs or return policies sits below where most shoppers scroll, you’re hiding important details from the majority of your audience.
The “average fold” line shows where most screens cut off content. Anything below this line reaches fewer shoppers than you might expect.
Form field interaction patterns
Heatmaps can highlight which form fields receive the most attention—and which cause repeated interactions suggesting confusion. Fields with unusually high interaction counts often benefit from clearer labels or better formatting guidance.
Look for patterns across many sessions rather than individual outliers. Consistent friction on a specific field indicates a systematic problem worth addressing.
Cross-device heatmap comparison
Compare mobile and desktop heatmaps side by side. Elements that work on desktop often fail on mobile: buttons that are easy to click with a mouse become difficult to tap with a finger, and layouts that look clean on a large screen become cramped on a phone.
Mobile heatmaps frequently reveal tap accuracy problems—scattered clicks around a button rather than directly on it suggest the target is too small.
How to segment checkout behavior by customer type
First-time vs returning customers
First-time shoppers typically look for more reassurance—trust signals, clear policies, and straightforward forms. Returning customers expect their information to be saved and the process to be faster.
Segmenting by customer type reveals whether your checkout serves both groups well or creates friction for one while working for the other.
High-value vs low-value carts
Cart value affects abandonment reasons. High-value shoppers may be more sensitive to shipping costs as a percentage of their order, while low-value shoppers might abandon when shipping exceeds the product price.
Analyzing these segments separately helps you understand whether a single fix addresses both groups or whether different solutions are appropriate.
Traffic source and campaign segments
Shoppers from different sources arrive with different expectations. Someone clicking a specific product ad expects to find that product easily, while someone from organic search might be earlier in their decision process.
Campaign-level behavior analysis reveals whether certain traffic sources consistently struggle with checkout, suggesting a mismatch between ad messaging and checkout experience.
Device and browser segments
Technical issues often affect specific devices or browsers rather than all shoppers equally. Segmenting by device and browser helps isolate whether a problem is universal or limited to a particular technical environment.
If abandonment spikes on a specific browser version, you’ve likely found a technical bug rather than a UX problem.
How to fix checkout issues based on behavior data
Simplify form fields causing hesitation
When recordings show repeated attempts on a specific field, the fix is usually simplification: clearer labels, helper text explaining the expected format, or removing optional fields entirely.
Watch for fields where shoppers pause, retype, or show visible frustration. These are your highest-priority targets for form optimization.
Add trust signals where customers pause
If heatmaps show hovering over security areas or recordings show hesitation at payment entry, add trust messaging exactly where the hesitation occurs. Security badges, guarantee text, and clear contact information reduce anxiety at decision moments.
Place trust signals within the visual flow of the checkout rather than buried in footers where hesitant shoppers have to search for them.
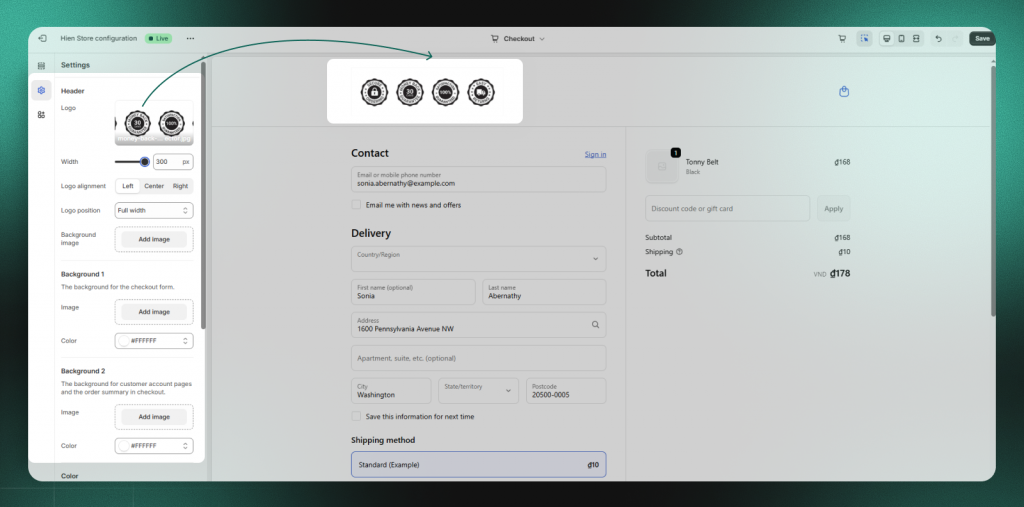
Pro tips:
Non-Shopify Plus merchants cannot modify the checkout UI directly. However, you can still boost credibility by using this clever workaround: Incorporate your trust badges (such as SSL, money-back guarantees, or payment icons) directly into your Header Logo or Checkout Background Image within your Shopify theme settings. This ensures that even without custom code, your high-trust signals are prominently visible to the customer during the most critical stage of the conversion funnel.
Optimize mobile checkout elements
Mobile-specific fixes include larger tap targets, simplified layouts, and ensuring form fields remain visible when the keyboard appears. Test changes on actual mobile devices rather than just browser simulations.
If mobile heatmaps show scattered taps around buttons, increase button size and add more spacing between interactive elements.
Address payment step drop-offs
Payment step abandonment often responds to adding more payment options, displaying security messaging more prominently, or simplifying the payment form itself.
Watch recordings of payment step abandonment to understand whether shoppers are looking for alternatives, hesitating over security, or struggling with the form mechanics.
Reduce shipping cost surprises
When recordings show abandonment immediately after shipping costs appear, consider showing shipping estimates earlier in the journey, offering free shipping thresholds, or explaining shipping costs more clearly before checkout.
The goal is eliminating surprise—shoppers who know what to expect are less likely to abandon when they see the final number.
Best tools for Shopify checkout behavior analytics
| Tool | Shopify-Native | Checkout Recording | Heatmaps | Session Replay | Funnel Analytics |
| Mida | Yes | Yes | Yes | Yes | Yes |
| Shopify Native | Yes | Limited | No | No | Basic |
| Generic Tools | Varies | Varies | Varies | Varies | Varies |
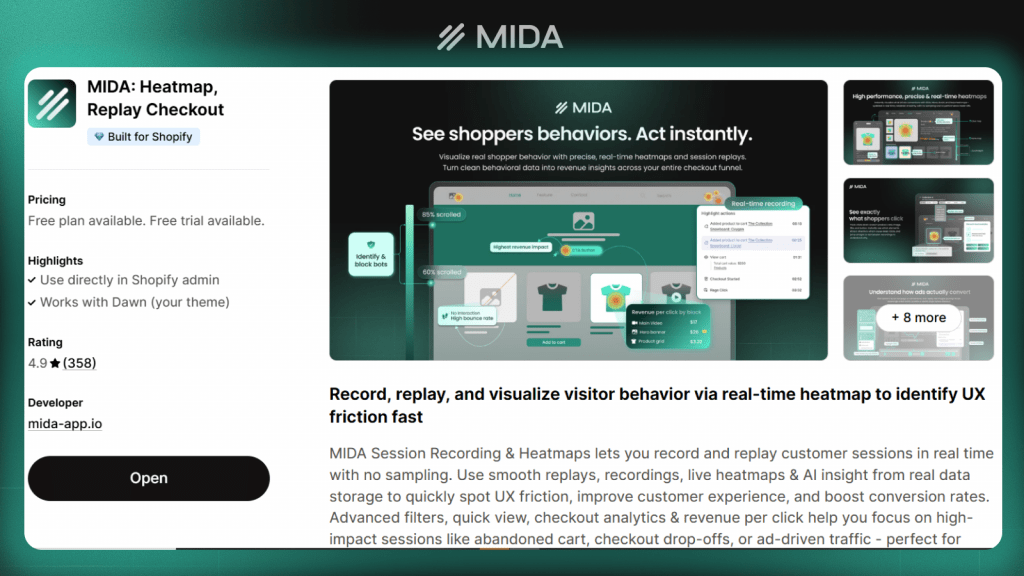
Mida
Mida is built exclusively for Shopify, offering automatic checkout event tracking, abandoned cart filtering, revenue-linked session replay, and element-level heatmaps. The Shopify-native integration means customer profiles, orders, and checkout events connect automatically without custom setup.
Shopify native behavior reports
Shopify’s built-in reports provide basic funnel visualization and conversion rate breakdowns. However, they lack session replay, heatmaps, and element-level detail—you can see where drop-offs happen but not why.
Other third-party behavior analytics apps
Generic tools like Hotjar or Lucky Orange offer behavior analytics but aren’t Shopify-specific. This often means incomplete checkout visibility or missing ecommerce-aware segmentation features that Shopify-native tools provide automatically.
How to measure checkout optimization results
Checkout conversion rate by step
Track the percentage of shoppers moving from each checkout step to the next. Compare step-by-step rates before and after your changes to identify specific improvements.
A fix that improves shipping-to-payment conversion by 5% has a measurable, attributable impact you can track over time.
Cart abandonment rate changes
Monitor your overall cart abandonment rate as a trending metric. While individual fixes target specific friction points, the aggregate rate shows whether your optimization efforts are moving the needle overall.
Behavior signal improvements
Watch new session recordings after implementing fixes to confirm that friction is actually reduced. Fewer rage clicks, less hesitation, and smoother session flow indicate successful optimization even before conversion numbers change.
Revenue impact analysis
Connect behavior improvements to business outcomes by linking increased completed orders to the sessions where your fixes were implemented. This closes the loop between observation, action, and result.
Turn checkout behavior into conversion growth
The shift from guessing at checkout problems to observing real customer behavior changes how you approach optimization. Instead of debating what might be wrong, you watch what actually happens and fix what you see.
Ongoing monitoring—reviewing weekly reports, continuing to watch session replays, tracking funnel metrics—turns one-time fixes into continuous improvement. Each optimization builds on the last, creating compounding gains over time.
FAQs about Shopify checkout behavior analytics
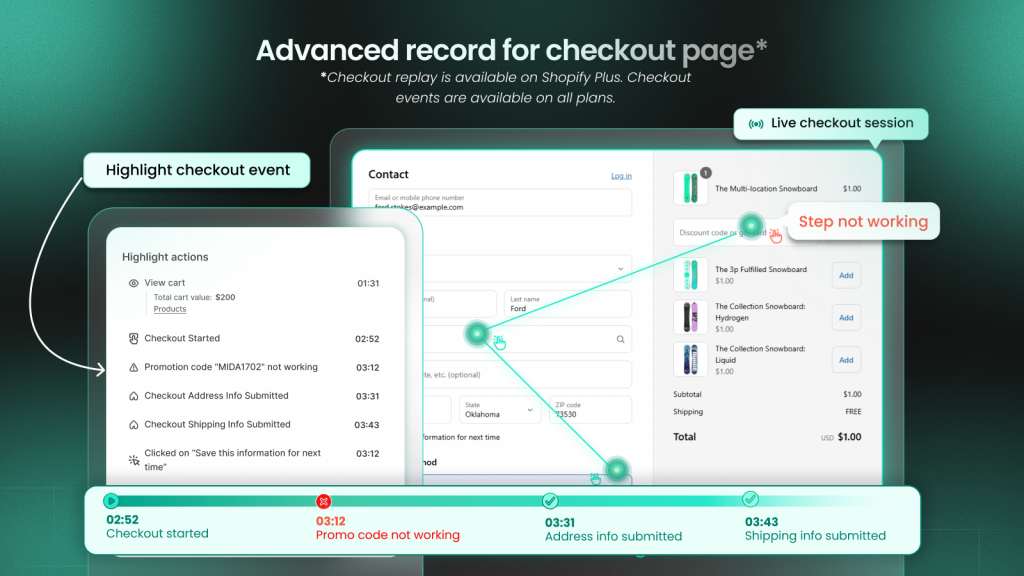
Can behavior analytics tools record activity inside Shopify’s checkout pages?
Yes, Shopify-native tools like Mida capture session activity within checkout pages for Shopify plus store. Payment card fields are automatically masked for security and PCI compliance—you see the behavior without seeing sensitive data.
How many checkout session recordings should you review before making changes?
Look for patterns rather than hitting a specific number. When you observe the same friction point across multiple different shoppers—typically 10 to 20 sessions showing the same issue—you have sufficient evidence to prioritize a fix.
What checkout conversion rate should Shopify stores aim for?
Benchmarks vary significantly by industry, product type, price point, and traffic source. Focus on improving your own baseline rather than chasing a universal number. A 10% improvement on your current rate matters more than hitting an arbitrary target.
How does behavior analytics differ from Google Analytics for checkout optimization?
Google Analytics shows aggregate metrics—abandonment rates, traffic flow, conversion percentages. Behavior analytics shows the actual clicks, scrolls, and hesitation patterns that explain why those numbers occur. One tells you what happened, while the other shows you why.
Does adding behavior analytics tracking slow down Shopify checkout pages?
Lightweight, Shopify-native behavior analytics tools load asynchronously without impacting checkout page speed. The tracking scripts load after your page content renders, so shoppers experience no delay.


